

What Is RSI? Understanding Momentum, Overbought and Oversold Markets
CoinBrain Research Articles | Learn Trading — Article 03
Updated: August 2026
After learning how to read candlesticks and identify support and resistance, the next question traders often ask is:
How strong is the current price move?
A cryptocurrency may be rising, but is buying momentum strengthening or beginning to weaken?
Price may be falling, but is selling pressure accelerating or becoming exhausted?
One of the most widely used technical indicators for answering these questions is the:
Relative Strength Index — RSI
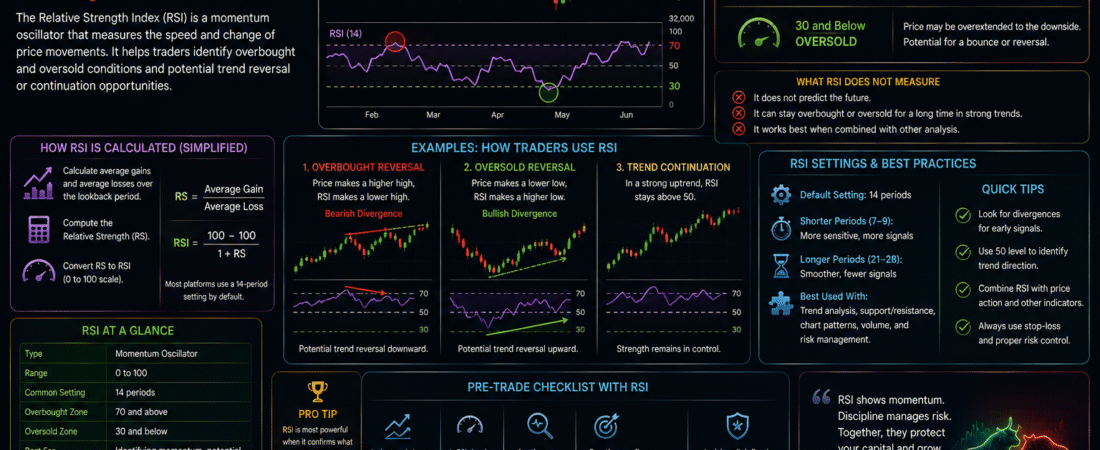
RSI is a momentum oscillator that measures the strength and speed of recent price movements.
It moves between:
0 and 100
and is commonly used to identify:
- momentum
- overbought conditions
- oversold conditions
- divergences
- potential trend continuation
- possible momentum exhaustion
Beginners frequently learn two simple rules:
RSI above 70 = Sell
RSI below 30 = Buy
Unfortunately, real markets are not that simple.
A strong cryptocurrency can remain overbought for a long time while continuing to rise.
A weak asset can remain oversold while continuing to fall.
The real value of RSI comes from understanding momentum in context.
That means combining RSI with:
Trend + Support & Resistance + Candlesticks + Market Structure + Volume + Risk Management
RSI should help confirm or challenge an investment idea.
It should rarely be the entire reason for a trade.
Educational Notice: This article is for educational and research purposes only. It does not constitute financial or investment advice. RSI and other technical indicators do not predict future market movements with certainty. Cryptocurrency trading can result in significant losses, particularly when leverage is used.
1. Executive Summary
The Relative Strength Index (RSI) is a technical momentum indicator developed by J. Welles Wilder Jr.
It measures the magnitude of recent upward and downward price changes and converts them into an oscillator ranging from:
0 to 100
The most commonly used RSI period is:
14 periods
This could mean:
- 14 minutes
- 14 hours
- 14 days
- 14 weeks
depending on the chart timeframe.
Traditionally:
RSI above 70
is described as:
Overbought
while:
RSI below 30
is described as:
Oversold
But these terms are frequently misunderstood.
Overbought does not mean price must immediately fall.
And:
Oversold does not mean price must immediately rise.
Instead, they indicate that recent price movement has been unusually strong in one direction.
RSI can also help traders analyze:
- bullish divergence
- bearish divergence
- momentum trends
- failure swings
- trend regimes
- support and resistance within the indicator itself
The most useful framework is therefore:
Price Structure
RSI Momentum
Market Context
Rather than:
RSI Signal = Automatic Trade
2. Key Takeaways
1. RSI measures momentum
It helps traders evaluate the strength of recent price movement.
2. RSI ranges from 0 to 100
This makes it an:
oscillator.
3. RSI 70 is traditionally considered overbought
But overbought does not automatically mean bearish.
4. RSI 30 is traditionally considered oversold
But oversold does not automatically mean bullish.
5. Strong trends can keep RSI extreme
During powerful bull markets, RSI may remain above 70 for extended periods.
During strong downtrends, RSI may repeatedly remain below 30.
6. Divergence can reveal weakening momentum
Price and RSI sometimes move in different directions.
This can indicate that momentum no longer confirms the price trend.
7. RSI works differently in trending and ranging markets
Signals that work well inside a range may perform poorly during a strong trend.
8. Timeframe matters
A daily RSI signal is generally more significant for long-term traders than a five-minute RSI reading.
9. RSI should be combined with price structure
Support, resistance and candlestick behavior can provide important confirmation.
10. RSI can help identify momentum—not exact tops and bottoms
Trying to use RSI to perfectly time reversals is a common beginner mistake.
11. Indicator settings matter
Shorter RSI periods react faster but generate more noise.
Longer periods react more slowly.
12. Risk management remains essential
Even strong RSI setups can fail.
3. Market Overview
What Is Momentum?
Momentum describes the strength and speed of price movement.
Imagine Bitcoin rises:
$90,000 → $91,000 → $92,000
over several days.
Now compare:
$90,000 → $95,000 → $102,000
during the same period.
Both markets are rising.
But the second demonstrates much stronger momentum.
RSI attempts to quantify this type of difference.
Why Momentum Matters
Trends often continue while momentum remains healthy.
But eventually momentum can weaken.
For example:
Price continues rising
while:
each new rally becomes less powerful.
This can indicate that buyers are becoming less aggressive.
Momentum indicators can help reveal this change before it becomes obvious from price alone.
Oscillators
RSI belongs to a family of indicators called:
Momentum Oscillators
An oscillator moves within a defined or approximately defined range.
RSI moves between:
0 and 100
This makes it useful for comparing recent buying strength with recent selling strength.
RSI in Crypto Markets
Crypto’s high volatility makes RSI particularly popular.
It is commonly applied to:
- Bitcoin
- Ethereum
- altcoins
- spot markets
- perpetual futures
- intraday charts
- swing trading
But volatility also creates challenges.
Crypto assets can reach extreme RSI readings more frequently than some traditional markets.
This means rigid interpretation can be dangerous.
4. Technical Deep Dive
How RSI Is Calculated
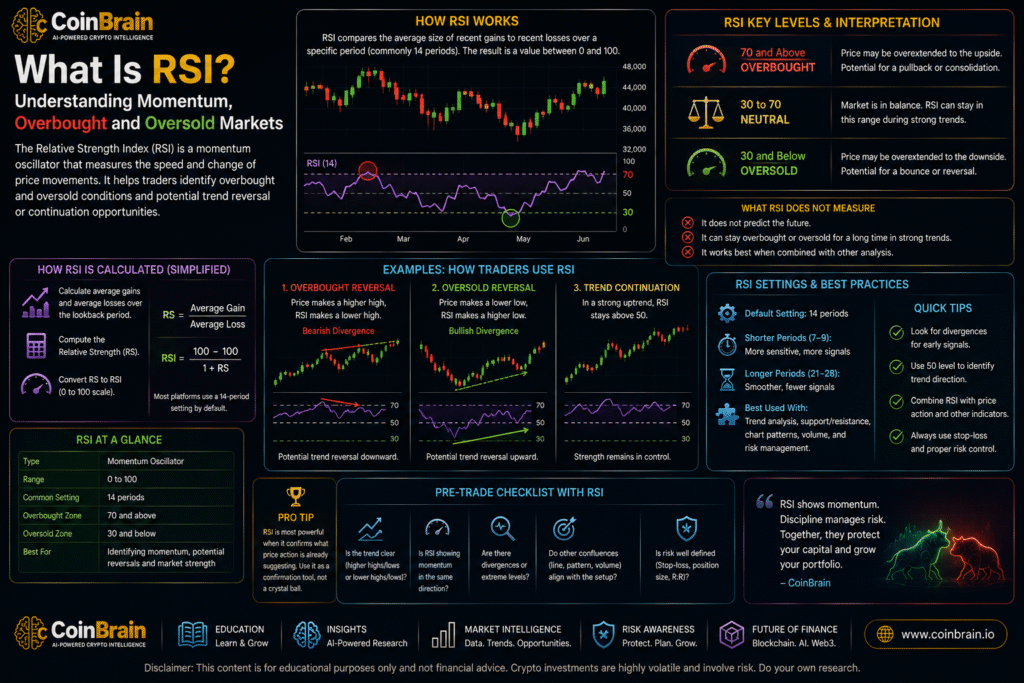
RSI is based on the relationship between average recent gains and average recent losses.
The simplified formula begins with:
Relative Strength (RS) = Average Gain ÷ Average Loss
Then:
RSI = 100 − [100 ÷ (1 + RS)]
The standard calculation usually uses:
14 periods.
The original Wilder methodology also applies smoothing to subsequent values rather than simply recalculating a basic arithmetic average from scratch every period.
A Simplified Example
Suppose over a chosen lookback period:
Average gain:
2
Average loss:
1
Then:
RS = 2 ÷ 1 = 2
RSI becomes:
100 − [100 ÷ (1 + 2)]
100 − 33.33
≈ 66.67
This indicates relatively strong positive momentum.
Why RSI Approaches 100
If gains greatly exceed losses:
RS increases
and RSI moves toward:
100.
Why RSI Approaches 0
If losses greatly exceed gains:
RS decreases
and RSI moves toward:
0.
The Standard 14-Period RSI
The most common default setting is:
RSI 14
On a daily chart:
14 periods = approximately 14 daily candles.
On a four-hour chart:
14 periods = 14 four-hour candles.
The indicator therefore changes meaning depending on timeframe.
Overbought: RSI Above 70
Traditional interpretation:
RSI > 70 = Overbought
This means recent gains have been unusually strong relative to losses.
But the word:
overbought
can be misleading.
It does not mean:
“too expensive.”
It means:
recent upward momentum has been strong.
A powerful trend may remain overbought for considerable time.
Oversold: RSI Below 30
Traditional interpretation:
RSI < 30 = Oversold
This indicates unusually strong recent downward momentum.
Again:
Oversold ≠ Automatically Undervalued
A fundamentally weak token can remain oversold while continuing toward zero.
RSI Around 50
The:
50 level
can help traders interpret momentum direction.
Generally:
RSI above 50
suggests positive momentum dominates.
RSI below 50
suggests negative momentum dominates.
Some traders therefore use 50 as a trend confirmation level.
RSI Trend Regimes
One useful interpretation is that RSI behaves differently in bull and bear markets.
Bullish Regime
RSI may frequently move between approximately:
40–80
with pullbacks finding support near the 40–50 region.
Bearish Regime
RSI may frequently trade around:
20–60
with rallies struggling around 50–60.
These are not strict rules.
But they illustrate why the same RSI value can mean different things depending on trend.
RSI Divergence
Divergence occurs when:
Price
and:
RSI
move differently.
This can indicate weakening momentum.
Bullish Divergence
Price creates:
Lower Low
while RSI creates:
Higher Low
Example:
Price:
$100 → $90 → $80
RSI:
25 → 28 → 35
Price continues falling.
But bearish momentum is weakening.
This can suggest potential reversal conditions.
However:
Bullish divergence is not automatically a buy signal.
Bearish Divergence
Price creates:
Higher High
while RSI creates:
Lower High
Example:
Price:
$100 → $110 → $120
RSI:
78 → 74 → 68
Price continues rising.
But momentum is weakening.
This can warn that the rally is losing strength.
Hidden Bullish Divergence
A more advanced concept occurs when:
Price makes:
Higher Low
while RSI makes:
Lower Low
This can sometimes support:
trend continuation
rather than reversal.
Hidden Bearish Divergence
Price makes:
Lower High
while RSI makes:
Higher High
This can indicate bearish trend continuation.
For beginners, regular bullish and bearish divergences should be mastered first.
RSI Failure Swings
Wilder also described RSI failure swings.
A bullish example might involve RSI:
- moving below 30
- recovering
- pulling back without reaching the previous low
- breaking the previous RSI high
This can indicate momentum reversal.
The bearish version operates in the opposite direction.
5. Current Industry Landscape
RSI remains one of the default indicators on virtually every major trading platform.
It is widely available through:
- TradingView
- crypto exchanges
- professional trading terminals
- brokerage platforms
- algorithmic trading systems
Its popularity comes from several advantages.
Simplicity
RSI compresses momentum into one number:
0–100
This makes it easy to understand visually.
Cross-Market Use
RSI can be used across:
- stocks
- futures
- forex
- commodities
- crypto
Multiple Timeframes
The same indicator can support:
- scalpers
- day traders
- swing traders
- longer-term investors
depending on timeframe.
Algorithmic Trading
RSI is also commonly incorporated into systematic trading rules.
For example:
RSI < 30
might be one input among many.
Professional systems rarely rely on RSI alone.
They may combine:
- trend
- volatility
- volume
- price structure
- macro conditions
Crypto-Specific Challenges
Crypto frequently experiences:
- large momentum moves
- liquidation cascades
- overnight volatility
- weekend moves
- sudden narrative rotations
This can push RSI into extreme regions more often.
A rigid:
RSI 70 = Short
strategy can therefore perform poorly during powerful crypto bull trends.
6. Institutional Activity
Professional traders may monitor RSI, but institutional decision-making generally uses more comprehensive momentum frameworks.
These may include:
- rate of change
- trend strength
- volatility
- order flow
- volume
- derivatives positioning
RSI can still serve as one useful signal.
Confirmation Rather Than Prediction
An institutional trader may see:
Price above major support
strong trend
RSI holding above 50
and interpret this as supporting momentum.
The trader does not necessarily wait for:
RSI below 30
to buy.
Momentum Strategies
Momentum itself is a major quantitative investment factor.
Professional strategies may systematically favor assets exhibiting persistent relative strength.
RSI is one simple way of visualizing momentum, though institutional models are usually much more sophisticated.
Multi-Timeframe Analysis
A professional trader might evaluate:
Weekly RSI
for long-term market regime.
Daily RSI
for trend momentum.
4-Hour RSI
for trade timing.
This can prevent lower-timeframe signals from overriding larger market structure.
Derivatives Context
Crypto traders may combine:
RSI
with:
- open interest
- funding rates
- liquidation data
For example:
Overbought RSI
extremely positive funding
rapidly rising open interest
may indicate a crowded leveraged long market.
This is richer information than RSI alone.
7. Market Data & Metrics
Several RSI measurements deserve attention.
1. Current RSI Value
Example:
RSI = 72
This indicates strong recent positive momentum.
It does not automatically indicate a short trade.
2. RSI 70 Level
Traditionally:
Overbought Zone
3. RSI 30 Level
Traditionally:
Oversold Zone
4. RSI 50 Level
Useful as a simplified momentum midpoint.
5. RSI Trend
Do not only read the current value.
Ask:
Is RSI:
- rising?
- falling?
- forming higher lows?
- forming lower highs?
6. Divergence
Compare:
Price Highs and Lows
against:
RSI Highs and Lows
7. Duration in Extreme Zones
One candle above 70 differs from RSI remaining above 70 for many periods.
Sustained extremes can indicate very strong trends.
8. Timeframe
RSI 80 on:
five-minute chart
has very different significance from:
weekly RSI 80.
9. Historical RSI Behavior
Different assets behave differently.
Study how a specific cryptocurrency’s RSI behaved during previous:
- rallies
- corrections
- bear markets
10. RSI Relative to Support and Resistance
Suppose Bitcoin reaches major support while RSI is:
28
This creates more context than either signal alone.
8. Real-World Use Cases
Use Case 1 — Oversold at Support
Suppose Ethereum approaches:
$3,000 support
and daily RSI reaches:
29.
A trader does not automatically buy.
Instead, the trader watches for:
- support reaction
- bullish candle
- RSI recovery
If several signals align, confidence may improve.
Use Case 2 — Overbought During Strong Trend
Bitcoin breaks major resistance.
RSI reaches:
76.
A beginner says:
“RSI is overbought. Bitcoin must fall.”
Instead, price continues rising for several weeks.
Lesson:
Overbought can indicate strong momentum—not necessarily immediate reversal.
Use Case 3 — Bearish Divergence
Price:
$95,000 → $100,000 → $105,000
RSI:
78 → 73 → 67
Price makes higher highs.
RSI makes lower highs.
This suggests momentum is weakening.
A trader may:
- tighten risk
- avoid chasing
- wait for confirmation
rather than immediately shorting.
Use Case 4 — Bullish Divergence
Price:
$80 → $72 → $68
RSI:
25 → 29 → 36
Selling continues, but momentum weakens.
If price also reaches major support and forms bullish candlesticks, the setup becomes more meaningful.
Use Case 5 — RSI 50 Trend Confirmation
During an uptrend:
RSI repeatedly falls toward:
45–50
then rebounds.
This can suggest momentum remains structurally positive.
Use Case 6 — Breakout Confirmation
Resistance:
$100
Price breaks to:
$105
while RSI moves:
55 → 68
This indicates accelerating momentum behind the breakout.
Use Case 7 — Avoiding Weak Breakouts
Price breaks resistance slightly.
But RSI remains:
45
and begins falling.
The lack of momentum confirmation may encourage caution.
9. Risks & Challenges
RSI is easy to understand.
That makes it easy to misuse.
1. Overbought Does Not Mean Sell
This is the most common mistake.
Strong assets can stay overbought.
2. Oversold Does Not Mean Buy
Weak assets can continue falling.
3. Divergence Can Persist
Bearish divergence can appear long before a market finally reverses.
Shorting too early can be expensive.
4. Indicator Lag
RSI uses historical price data.
It therefore reacts to price rather than predicting it independently.
5. Strong Trends Break Normal RSI Expectations
Trend context matters.
6. Low-Timeframe Noise
Very short timeframes can produce frequent meaningless RSI signals.
7. Changing Settings Until the Chart Looks Perfect
A trader tries:
RSI 14
then:
RSI 9
then:
RSI 5
until historical signals look perfect.
This is:
overfitting.
The settings may fail in future markets.
8. Ignoring Price Structure
RSI is secondary to actual price.
If price is breaking major support, an oversold reading alone should not automatically override that evidence.
9. Confirmation Bias
A trader wanting to buy may focus only on an oversold RSI.
A trader wanting to short may focus only on bearish divergence.
Use multiple sources of evidence.
10. Indicator Stacking
Beginners sometimes add:
- RSI
- MACD
- Stochastic
- CCI
and assume four indicators provide four independent confirmations.
Many momentum indicators measure similar information.
This can create:
false confidence.
11. Leverage
An RSI setup can fail temporarily even if the broader thesis eventually works.
Excessive leverage can liquidate the position first.
12. News Can Override Technical Signals
Unexpected events can produce immediate repricing regardless of RSI conditions.
10. Future Outlook: 3–5 Years
RSI itself is unlikely to disappear.
But technical-analysis systems around it will become more sophisticated.
Context-Aware RSI
Future platforms may stop displaying only:
RSI = 74
and instead explain:
“RSI is elevated, but the asset remains in a strong weekly uptrend and has historically stayed above 70 during similar momentum phases.”
This is far more useful.
AI Pattern Recognition
AI may automatically detect:
- bullish divergence
- bearish divergence
- failure swings
- trend regimes
across thousands of markets.
Multi-Factor Analysis
Future systems may combine:
RSI
Volume
Market Structure
Funding
Open Interest
On-Chain Activity
to produce richer momentum analysis.
Personalized Trading Tools
Platforms may learn which RSI setups historically performed best for a particular:
- asset
- timeframe
- trading strategy
Automated Risk Alerts
Instead of:
“RSI is overbought.”
a risk system might say:
“Daily RSI is above 75 while funding, open interest and price acceleration are simultaneously elevated.”
That provides better context for traders.
11. Investment & Trading Implications
A beginner can use RSI through a disciplined process.
Step 1 — Determine Market Trend
Before reading RSI, ask:
Uptrend?
Downtrend?
Range?
Step 2 — Identify Support and Resistance
Use what we learned in Article 02.
Determine where price is trading relative to important levels.
Step 3 — Read Current RSI
Example:
RSI 65
This indicates positive momentum.
Do not interpret the number alone.
Step 4 — Observe RSI Direction
Is RSI:
rising
or:
falling?
Momentum direction matters.
Step 5 — Check Extreme Zones
Has RSI entered:
70+
or:
30-?
Ask why.
Step 6 — Look for Divergence
Compare major price highs and lows against RSI.
Step 7 — Check Candle Confirmation
Suppose:
Price reaches support.
RSI is oversold.
Now ask:
Did candlesticks actually show buyers entering?
Step 8 — Use Higher Timeframes
Example:
Daily RSI:
68
Four-hour RSI:
35
The short-term chart may be oversold within a strong longer-term trend.
This creates very different context from both timeframes being deeply bearish.
Step 9 — Define Invalidation
RSI does not replace price-based invalidation.
If the trade thesis depends on:
$90 support holding
then a sustained break below support may invalidate the idea regardless of RSI.
Step 10 — Calculate Risk-to-Reward
Technical indicators should help identify opportunities.
Risk management determines whether to trade them.
A Beginner Example
Suppose Bitcoin trades near:
$90,000
which has previously acted as support.
Price
Bitcoin falls from:
$100,000 → $90,000
RSI
Daily RSI falls to:
29
Candlestick
Bitcoin briefly trades at:
$88,500
but closes:
$92,000
with a long lower wick.
Volume
Trading volume increases.
The beginner might see:
RSI < 30
and think:
Buy.
The more disciplined interpretation is:
Support
Oversold Momentum
Lower-Price Rejection
Increasing Participation
This combination provides a better technical thesis.
Even then, the trade can fail.
Therefore:
Invalidation and position sizing remain mandatory.
Example: RSI Trap
Suppose a small altcoin drops from:
$10
to:
$5.
RSI:
25
The investor buys because:
“It is oversold.”
Price falls:
$5 → $3
RSI remains below 30.
The investor buys more.
Price falls:
$3 → $1
Later the project collapses.
The problem was not RSI.
The problem was assuming:
Oversold = Fundamentally Cheap
These are completely different concepts.
A Simple RSI Framework
Bullish Setup
Look for combinations such as:
Uptrend
Support
RSI Pullback
Bullish Candlestick Confirmation
rather than:
RSI < 30 = Buy
Bearish Setup
Look for:
Downtrend
Resistance
RSI Rally
Bearish Candlestick Confirmation
rather than:
RSI > 70 = Sell
The CoinBrain RSI Checklist
Before using RSI in a trade, ask:
Trend
- Is the market trending or ranging?
Timeframe
- Which RSI timeframe am I analyzing?
Momentum
- Is RSI rising or falling?
Level
- Is RSI above or below 50?
Extreme
- Is RSI above 70 or below 30?
Context
- Is price near support or resistance?
Divergence
- Is RSI confirming price highs and lows?
Candles
- Is price action confirming the idea?
Volume
- Is participation supporting the move?
Invalidation
- What price proves the thesis wrong?
Risk
- How much capital am I willing to lose?
If the entire trade thesis is:
“RSI is oversold.”
more analysis is required.
Business Implications
RSI is also valuable for trading-platform design.
Platforms can provide:
- momentum alerts
- divergence detection
- multi-timeframe RSI
- historical signal analysis
- indicator education
AI can improve these systems.
Instead of sending:
“BTC RSI = 72.”
an intelligent platform could explain:
“Bitcoin’s daily RSI has moved above 70 after breaking major resistance. Momentum is strong, but the market is approaching a previous weekly supply zone.”
That transforms:
indicator data
into:
decision context.
12. Final Analysis
RSI is one of the most useful beginner indicators because it teaches an important market concept:
Price direction and momentum are not the same thing.
Price can continue rising while momentum weakens.
Price can continue falling while selling momentum weakens.
RSI helps reveal that difference.
But the indicator becomes dangerous when reduced to:
70 = Sell
and:
30 = Buy.
Markets are more complex.
A better interpretation is:
RSI Above 70
means:
recent upward momentum is unusually strong.
RSI Below 30
means:
recent downward momentum is unusually strong.
What happens next depends on:
Trend
Support & Resistance
Candlesticks
Volume
Market Structure
and:
Risk Conditions.
This gives us an increasingly useful trading framework.
From Article 01:
Candlesticks tell us how price is behaving.
From Article 02:
Support and resistance tell us where price behavior matters.
Now Article 03 adds:
RSI tells us how strong the momentum behind that behavior may be.
Together:
Price Action
Important Level
Momentum
creates a far stronger analytical framework than any indicator used alone.
The central CoinBrain principle is therefore:
Do not trade RSI numbers. Use RSI to understand momentum within market structure.
Technical indicators should help you ask better questions.
They should never replace thinking.
13. References & Further Reading
J. Welles Wilder Jr.
New Concepts in Technical Trading Systems
The original work introducing the Relative Strength Index alongside several other technical indicators developed by Wilder.
CMT Association
Momentum Analysis and Technical Indicators
Professional technical-analysis educational material covering momentum, oscillators, trends and confirmation.
Fidelity
Relative Strength Index — RSI
Educational material explaining RSI calculations, overbought and oversold conditions, divergences and technical-analysis applications.
Schwab
Using RSI in Technical Analysis
Educational guidance on interpreting momentum oscillators, trend conditions and overbought or oversold readings.
TradingView
Relative Strength Index
Charting documentation and educational resources covering RSI calculation, settings, divergences and indicator interpretation.
Concepts for Further Study
Readers progressing beyond the fundamentals should investigate:
- momentum
- oscillators
- Relative Strength Index
- RSI 14
- overbought conditions
- oversold conditions
- RSI 50
- bullish divergence
- bearish divergence
- hidden divergence
- RSI failure swings
- momentum confirmation
- trend regimes
- multi-timeframe RSI
- indicator lag
- technical-analysis confirmation
- price action
- support and resistance
- market structure
CoinBrain Learn Trading
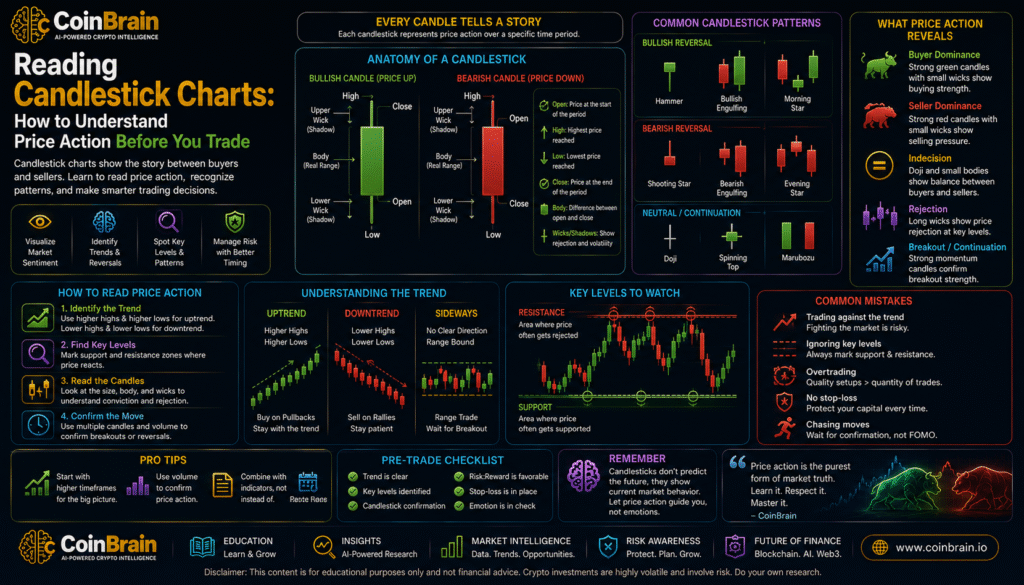
Article 01 — Reading Candlestick Charts: How to Understand Price Action Before You Trade
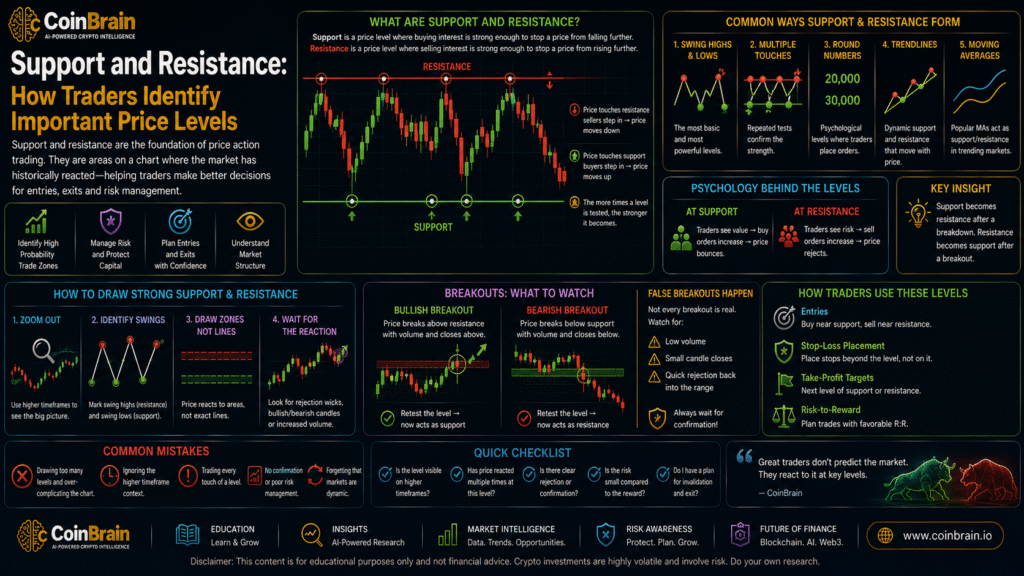
Article 02 — Support and Resistance: How Traders Identify Important Price Levels
Article 03 — What Is RSI? Understanding Momentum, Overbought and Oversold Markets
Next Article
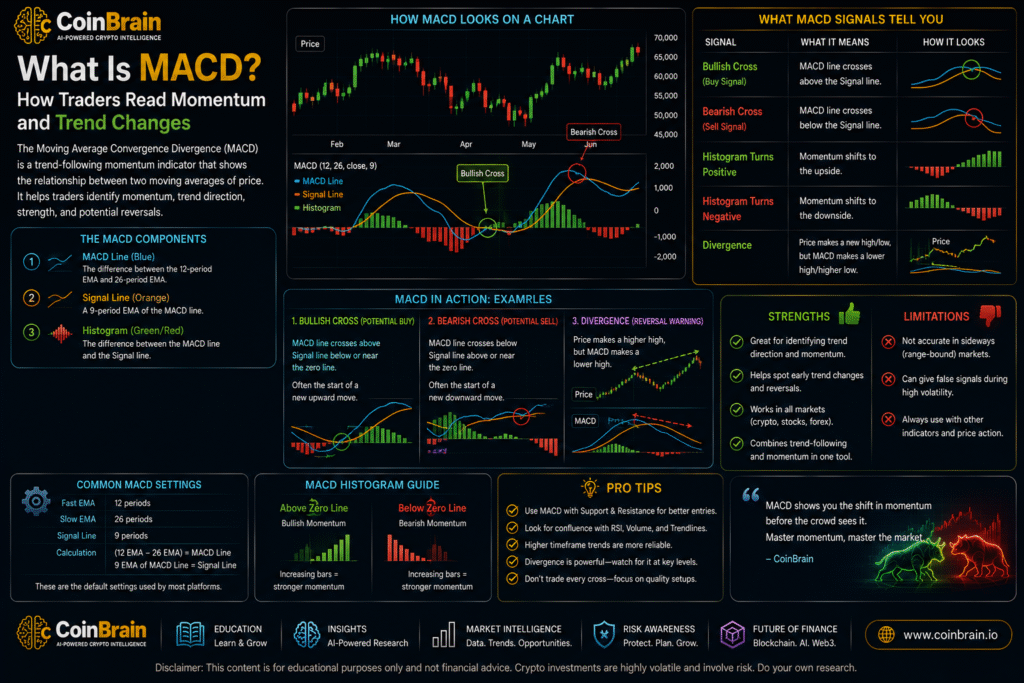
Article 04 — What Is MACD? How Traders Read Momentum and Trend Changes
CoinBrain Research Articles
Research. Understand. Decide.

Leave a Reply
You must be logged in to post a comment.