

What Is MACD? How Traders Read Momentum and Trend Changes
CoinBrain Research Articles | Learn Trading — Article 04
Updated: August 2026
A market can be rising while its momentum is weakening.
It can also be falling while selling pressure begins to fade.
Recognizing these changes is one of the central challenges of technical analysis.
The Moving Average Convergence Divergence, better known as MACD, was designed to help traders analyze exactly this relationship.
MACD combines two important concepts:
Trend
and:
Momentum
Instead of simply asking:
“Is price going up or down?”
MACD helps traders ask:
“Is the current trend gaining strength or losing momentum?”
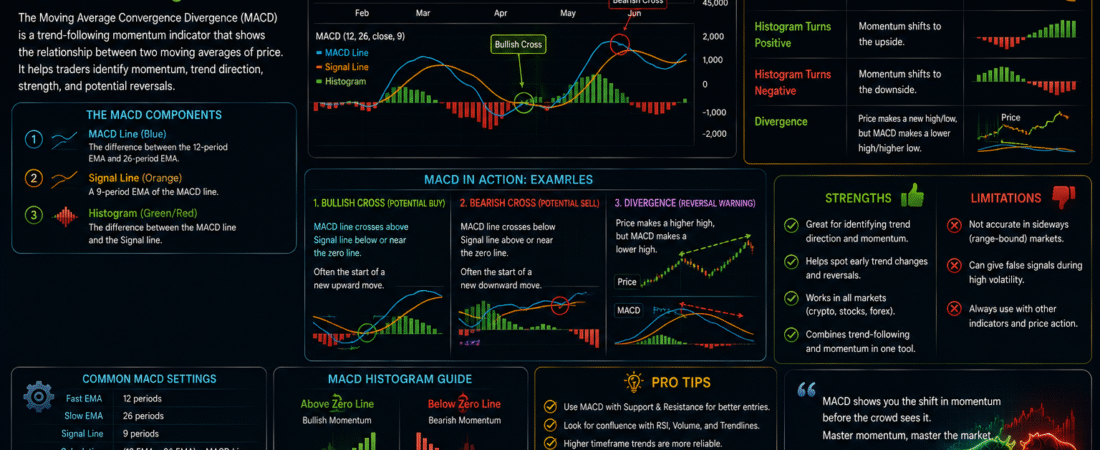
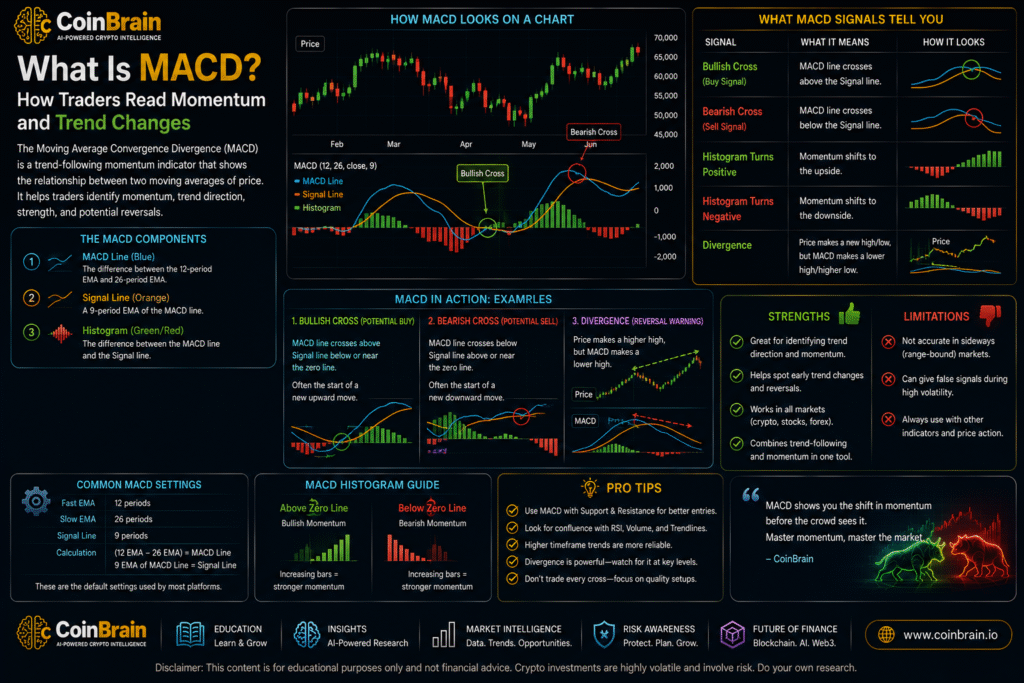
The indicator is built from exponential moving averages and typically contains three visual components:
- the MACD line
- the signal line
- the histogram
Traders commonly use these components to identify:
- momentum changes
- bullish and bearish crossovers
- trend direction
- acceleration and deceleration
- divergence
- potential trend transitions
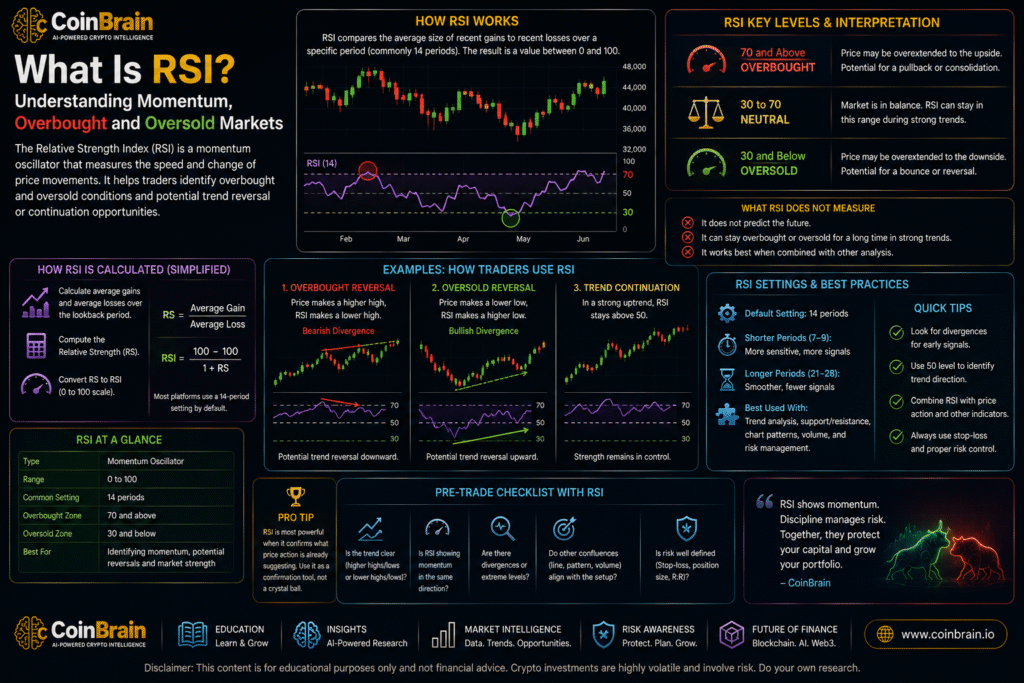
Like RSI, however, MACD is frequently oversimplified.
A beginner may learn:
MACD crosses up = Buy
MACD crosses down = Sell
Real trading is not that simple.
MACD can generate repeated false signals during sideways markets. It can also react after a price move has already started because it is calculated from historical price data.
Its greatest value comes when it is combined with:
Market Structure + Support & Resistance + Candlesticks + Momentum + Volume + Risk Management
The objective is therefore not to trade every MACD crossover.
It is to understand what the indicator reveals about the changing relationship between trend and momentum.
Educational Notice: This article is for educational and research purposes only. It does not constitute financial or investment advice. MACD and other technical indicators do not reliably predict future price movements. Cryptocurrency trading involves significant risk, particularly when leverage is used.
1. Executive Summary
The Moving Average Convergence Divergence — MACD is a trend-following momentum indicator developed by Gerald Appel.
The standard MACD configuration is commonly written as:
12, 26, 9
These numbers represent:
- 12-period exponential moving average
- 26-period exponential moving average
- 9-period signal line
The basic calculation is:
MACD Line = 12-Period EMA − 26-Period EMA
The:
Signal Line
is generally a:
9-period EMA of the MACD Line.
The:
MACD Histogram
represents the difference between:
MACD Line − Signal Line
These three components help traders evaluate whether shorter-term price momentum is strengthening or weakening relative to the longer-term trend.
Common interpretations include:
Bullish Crossover
MACD line crosses above the signal line.
Bearish Crossover
MACD line crosses below the signal line.
Above Zero
Shorter-term average is above the longer-term average.
This generally supports bullish trend conditions.
Below Zero
Shorter-term average is below the longer-term average.
This generally supports bearish trend conditions.
Expanding Histogram
Momentum difference is increasing.
Contracting Histogram
Momentum difference is weakening.
The most important principle is:
MACD should be used as evidence of momentum and trend conditions—not as an automatic buy-and-sell system.
2. Key Takeaways
1. MACD combines trend and momentum
It measures the relationship between two exponential moving averages.
2. Standard MACD uses 12, 26 and 9 periods
These remain the most common default settings.
3. The MACD line compares short-term and longer-term momentum
It is commonly calculated as:
12 EMA − 26 EMA
4. The signal line smooths the MACD line
It helps traders identify momentum changes.
5. Crossovers can indicate changing momentum
But not every crossover creates a high-quality trade.
6. The zero line provides trend context
MACD above zero generally reflects stronger shorter-term pricing relative to the longer-term average.
7. The histogram measures the gap between MACD and its signal line
It can reveal acceleration or deceleration before an actual crossover occurs.
8. Divergence can reveal weakening momentum
Price may continue making new highs or lows while MACD fails to confirm them.
9. MACD works better in trending markets than in choppy markets
Sideways conditions can produce repeated false crossovers.
10. MACD is a lagging indicator
It is calculated from historical prices.
It therefore reacts to market changes rather than independently predicting them.
11. Timeframe matters
A bullish five-minute MACD signal can occur inside a bearish daily trend.
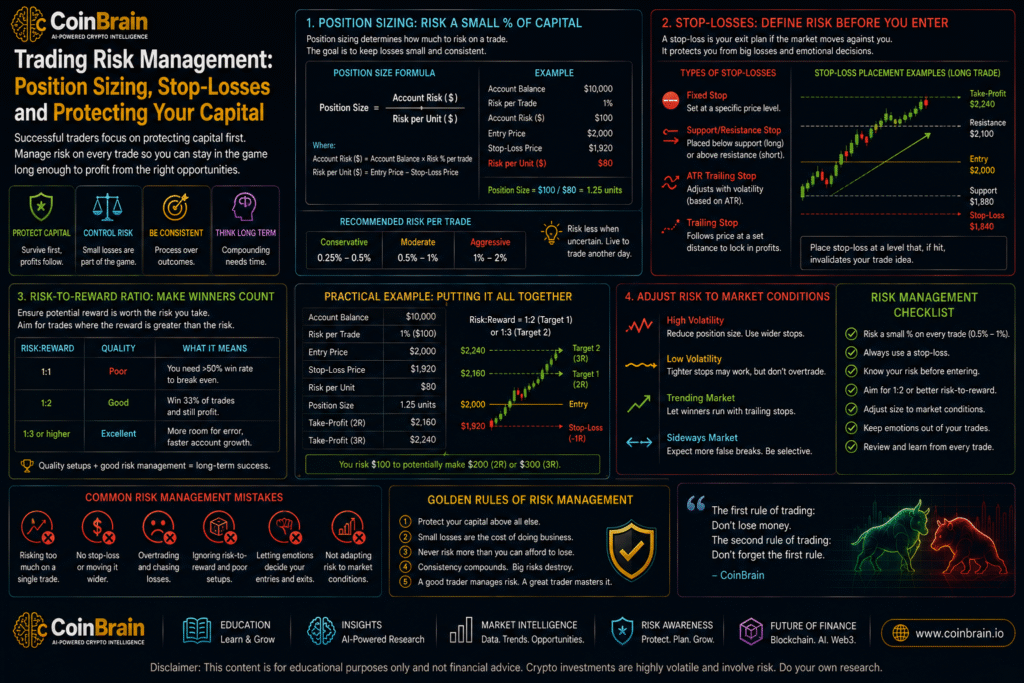
12. Risk management remains more important than the indicator
No crossover guarantees a successful trade.
3. Market Overview
Why Moving Averages Matter
Before understanding MACD, we need to understand moving averages.
A moving average smooths price data.
Instead of focusing on every small market fluctuation, it helps identify the broader direction.
For example, imagine an asset closes at:
$100
$102
$98
$105
$110
A moving average combines recent values to create a smoother trend representation.
Simple vs Exponential Moving Averages
Two commonly used moving averages are:
Simple Moving Average — SMA
Every included price receives equal weighting.
Exponential Moving Average — EMA
More recent prices receive greater weight.
MACD uses:
Exponential Moving Averages.
This allows the indicator to respond more quickly to recent price movements than an equivalent simple moving average.
Short-Term vs Long-Term Trend
Suppose Bitcoin’s short-term average begins rising rapidly.
Its longer-term average responds more slowly.
The distance between them increases.
This suggests:
momentum is accelerating.
MACD converts this changing relationship into an indicator.
Convergence
When two moving averages move closer together:
they converge.
This may indicate that the existing momentum is weakening.
Divergence
When the moving averages move farther apart:
they diverge.
This can indicate increasing directional momentum.
This is where the name comes from:
Moving Average Convergence Divergence.
4. Technical Deep Dive
Component 1 — MACD Line
The standard formula is:
MACD Line = 12-Period EMA − 26-Period EMA
Suppose:
12-period EMA:
$105
26-period EMA:
$100
MACD:
+5
The shorter-term average is above the longer-term average.
This suggests positive momentum.
Now suppose:
12-period EMA:
$95
26-period EMA:
$100
MACD:
-5
The shorter-term average is below the longer-term average.
This indicates negative momentum.
Component 2 — Signal Line
The signal line is typically:
9-Period EMA of the MACD Line
Its purpose is to smooth the MACD values.
Traders compare:
MACD Line
with:
Signal Line
to identify changes in momentum.
Component 3 — Histogram
The histogram is calculated as:
Histogram = MACD Line − Signal Line
Suppose:
MACD:
5
Signal:
3
Histogram:
+2
Now suppose:
MACD remains positive at:
4
while signal rises to:
3.8
Histogram:
+0.2
MACD is still bullish relative to the signal line.
But the momentum gap has narrowed considerably.
This can indicate:
bullish momentum is weakening.
Bullish MACD Crossover
A bullish crossover occurs when:
MACD Line crosses above Signal Line.
Conceptually:
Recent Momentum Improving
↓
MACD Moves Toward Signal
↓
MACD Crosses Above Signal
This can indicate a shift toward stronger upward momentum.
But confirmation matters.
Bearish MACD Crossover
A bearish crossover occurs when:
MACD Line crosses below Signal Line.
This can indicate strengthening downside momentum.
Again:
Crossover ≠ Guaranteed Reversal
Zero-Line Crossover
The zero line provides another important signal.
When:
MACD > 0
the shorter EMA is above the longer EMA.
When:
MACD < 0
the shorter EMA is below the longer EMA.
Bullish Zero-Line Crossover
MACD moves from negative to positive.
This can indicate that the shorter-term trend has strengthened enough to move above the longer-term trend.
Bearish Zero-Line Crossover
MACD falls from positive to negative.
This suggests shorter-term momentum has deteriorated relative to the longer-term trend.
Why Signal-Line and Zero-Line Crossovers Are Different
A signal-line crossover can occur:
before
a zero-line crossover.
Example:
MACD:
-5 → -3 → -1
Signal:
-4 → -3.5 → -2
MACD may cross above the signal line while both remain below zero.
This means:
momentum has improved
but:
broader trend conditions may still be bearish.
This distinction is extremely useful.
Reading the Histogram
The histogram provides a visual representation of momentum change.
Growing Positive Bars
Bullish momentum is expanding.
Shrinking Positive Bars
Bullish momentum is weakening.
Growing Negative Bars
Bearish momentum is increasing.
Shrinking Negative Bars
Bearish momentum is weakening.
The histogram can therefore begin changing before the MACD and signal lines actually cross.
MACD Divergence
Like RSI, MACD can diverge from price.
Bullish Divergence
Price makes:
Lower Low
while MACD makes:
Higher Low
Example:
Price:
$100 → $80 → $70
MACD:
-8 → -6 → -3
Price continues falling.
But bearish momentum becomes less severe.
This can signal potential exhaustion.
Bearish Divergence
Price makes:
Higher High
while MACD makes:
Lower High
Example:
Price:
$100 → $110 → $120
MACD:
8 → 6 → 4
Price continues rising while momentum weakens.
This can warn of potential trend deterioration.
MACD vs RSI
These indicators measure related but different characteristics.
RSI
Focuses strongly on:
momentum strength relative to recent gains and losses
and operates between:
0–100.
MACD
Focuses on:
the relationship between shorter and longer moving averages.
MACD has no fixed:
0–100
range.
Using both can provide complementary information.
But remember:
They both derive from price.
They should not be treated as completely independent confirmations.
5. Current Industry Landscape
MACD remains one of the most widely available technical indicators across modern trading platforms.
It is used across:
- cryptocurrencies
- equities
- forex
- commodities
- futures
- indices
Its continued popularity reflects its ability to combine:
trend-following analysis
with:
momentum analysis.
Crypto Trading
Crypto traders commonly apply MACD to:
- Bitcoin
- Ethereum
- altcoins
- spot markets
- perpetual futures
Common timeframes include:
- 15-minute
- 1-hour
- 4-hour
- daily
- weekly
Algorithmic Strategies
Because MACD can be expressed mathematically, it can easily be incorporated into systematic trading rules.
Example:
If MACD crosses above signal line AND price remains above long-term trend filter → evaluate long position.
This is much more sophisticated than:
MACD crossover = automatic buy.
Modern Charting Platforms
Trading platforms increasingly allow traders to customize:
- MACD periods
- signal-line length
- colors
- alerts
- multi-timeframe conditions
This flexibility can be useful.
It can also encourage over-optimization.
The Problem of Indicator Optimization
A trader may test:
12,26,9
then:
8,21,5
then:
5,35,7
until historical signals look perfect.
This creates:
curve fitting
or:
overfitting.
A strategy optimized perfectly for historical data may perform poorly in future markets.
6. Institutional Activity
Professional traders rarely use one MACD crossover as the basis for a major position.
Instead, momentum indicators are typically incorporated into broader analytical frameworks.
Trend Confirmation
An institution may consider:
Price Above Long-Term Trend
Positive MACD
Improving Market Breadth
as evidence of constructive momentum.
Quantitative Momentum
Momentum is one of the most extensively studied factors in professional finance.
Quantitative strategies can measure momentum using:
- returns
- moving averages
- rate of change
- relative strength
- trend models
MACD represents one accessible retail-friendly expression of this broader concept.
Multi-Timeframe Momentum
Professional traders may evaluate:
Weekly MACD
for long-term regime.
Daily MACD
for medium-term momentum.
4-Hour MACD
for execution timing.
A lower-timeframe bullish crossover carries more significance when it aligns with the higher-timeframe trend.
Combining Derivatives Data
Crypto professionals can combine MACD with:
- open interest
- funding rates
- options data
- liquidation levels
For example:
MACD weakening
high funding
rapidly increasing open interest
may suggest a market where bullish momentum is fading while leveraged positioning remains aggressive.
This does not guarantee reversal.
It identifies a risk condition.
7. Market Data & Metrics
Several MACD observations can improve analysis.
1. MACD Value
Is MACD:
positive
or:
negative?
This helps describe broader momentum orientation.
2. Signal-Line Relationship
Is the MACD line:
above
or:
below
its signal line?
3. Distance Between Lines
A large gap can indicate stronger momentum.
A narrowing gap can signal deceleration.
4. Histogram Direction
Are histogram bars:
- expanding?
- contracting?
The direction of change can be more useful than the absolute value.
5. Zero-Line Position
MACD above zero generally supports bullish trend conditions.
MACD below zero generally supports bearish conditions.
6. Zero-Line Distance
A MACD far above zero may indicate significant positive momentum.
But extreme distance can also occur after large price moves.
Context matters.
7. Divergence
Compare price highs and lows with MACD peaks and troughs.
8. Time Since Crossover
A crossover that occurred ten candles ago is different from one occurring now.
Avoid treating old signals as new information.
9. Timeframe
Daily MACD provides a different perspective from five-minute MACD.
10. Trend Context
The same bullish crossover means different things:
Above Zero in an Uptrend
Potential continuation.
Deep Below Zero in a Downtrend
Potential early recovery—but higher risk.
8. Real-World Use Cases
Use Case 1 — Bullish Trend Confirmation
Bitcoin is:
- making higher highs
- making higher lows
- trading above major support
MACD:
- remains above zero
- crosses above signal line
- histogram begins expanding
This can support the existing bullish thesis.
Use Case 2 — Early Momentum Recovery
Ethereum has been falling.
MACD remains below zero.
But:
- negative histogram bars become smaller
- MACD begins moving toward signal line
- bullish crossover occurs
This indicates:
downside momentum is weakening.
It does not yet prove a new uptrend.
Use Case 3 — Bearish Momentum Shift
Price approaches resistance.
MACD is positive but:
- histogram contracts
- MACD crosses below signal
This can signal weakening momentum.
If bearish candlesticks also appear at resistance, the evidence becomes stronger.
Use Case 4 — Bullish Zero-Line Crossover
Price has recovered from a long decline.
MACD first crosses above signal while below zero.
Later:
MACD crosses above zero.
This may provide stronger evidence that medium-term trend conditions are improving.
Use Case 5 — Bearish Divergence
Bitcoin makes:
$100,000
then:
$105,000
then:
$110,000
But MACD peaks become progressively lower.
Momentum is failing to confirm new price highs.
A disciplined trader might:
- reduce aggressive new entries
- tighten risk
- watch support
rather than immediately shorting.
Use Case 6 — Bullish Divergence
Price makes another lower low.
MACD makes a higher low.
At major support, this can suggest sellers are losing momentum.
Candlestick confirmation may then provide additional evidence.
Use Case 7 — Trend Filtering
A trader decides:
Only consider long trades while daily MACD remains above zero.
Then uses lower timeframes for entries.
MACD is being used as:
a filter
rather than:
an entry button.
This is often a more useful application.
9. Risks & Challenges
MACD has important limitations.
1. MACD Is Lagging
Its inputs are moving averages based on historical price data.
The indicator may confirm a trend only after price has already moved significantly.
2. False Crossovers
Sideways markets can produce:
Bullish crossover
↓
Bearish crossover
↓
Bullish crossover
repeatedly.
This is known as:
whipsaw.
3. Late Entries
A trader who waits for every confirmation may enter after much of the move has already happened.
4. Divergence Can Persist
Price may continue moving higher for a long time despite bearish divergence.
5. Ignoring Market Structure
A bullish MACD crossover directly below major resistance may have poor risk/reward.
6. Ignoring Higher Timeframes
A one-hour bullish crossover inside a powerful weekly downtrend should be interpreted carefully.
7. Over-Optimization
Constantly adjusting MACD parameters to fit historical charts creates unreliable strategies.
8. Indicator Dependence
A trader may become unable to make decisions without MACD.
Price remains the primary market information.
Indicators are derived from it.
9. Combining Similar Indicators
MACD and several other momentum indicators can produce overlapping information.
More indicators do not automatically create more independent evidence.
10. Trading Every Crossover
Crossovers occur frequently.
Not every signal deserves capital.
11. News and Fundamental Events
Unexpected developments can overwhelm technical signals immediately.
12. Leverage
A technically reasonable MACD setup can still fail.
Excessive leverage can make ordinary failure catastrophic.
10. Future Outlook: 3–5 Years
MACD itself is a mature indicator.
The innovation will increasingly occur around how it is interpreted.
AI-Enhanced Context
Instead of simply displaying:
Bullish MACD Crossover
future trading systems may explain:
“The daily MACD has crossed bullish while remaining below zero. Momentum is improving, but the broader trend has not yet fully turned positive.”
That interpretation is much more useful.
Multi-Timeframe Automation
Platforms may automatically analyze:
Weekly + Daily + 4-Hour MACD
and show whether momentum is aligned across timeframes.
Regime Detection
AI systems may determine whether the market is:
- trending
- ranging
- highly volatile
before interpreting MACD.
This can reduce false signals.
Integration with Volume
MACD signals can be combined automatically with:
- trading volume
- volume profile
- order flow
Derivatives Integration
Crypto platforms may combine:
MACD Momentum
Funding Rates
Open Interest
Liquidations
to provide better risk analysis.
Personalized Strategy Analytics
Trading platforms may eventually show:
“During the past three years, bullish daily MACD crossovers above zero performed differently for Bitcoin than crossovers below zero.”
This can help users understand the difference between generic signals and asset-specific behavior.
11. Investment & Trading Implications
A beginner should use MACD through a structured process.
Step 1 — Determine Market Structure
Before looking at MACD, identify:
Uptrend
Downtrend
or:
Range.
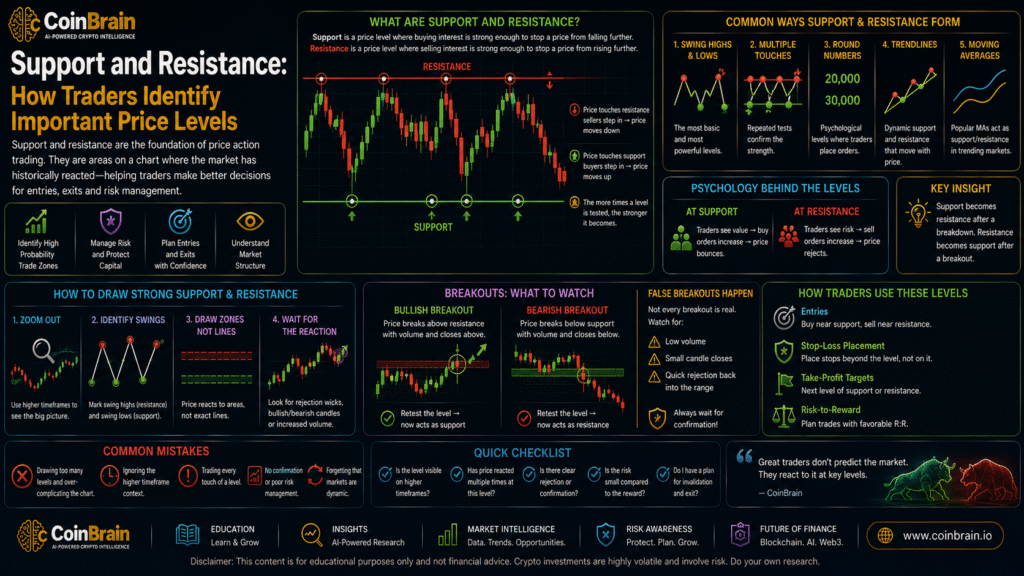
Step 2 — Mark Support and Resistance
Use the framework from Article 02.
Know where price is trading relative to important levels.
Step 3 — Check MACD Relative to Zero
Ask:
Positive or negative?
This provides broad trend context.
Step 4 — Check MACD vs Signal Line
Is there:
- bullish relationship?
- bearish relationship?
- fresh crossover?
Step 5 — Read the Histogram
Ask:
Is momentum expanding or contracting?
This can provide earlier context than waiting for a crossover.
Step 6 — Look for Divergence
Compare major price swings against MACD.
Step 7 — Check Higher Timeframe
Suppose:
4-hour MACD turns bullish.
Now check:
Daily MACD.
If both align, the signal may carry more significance.
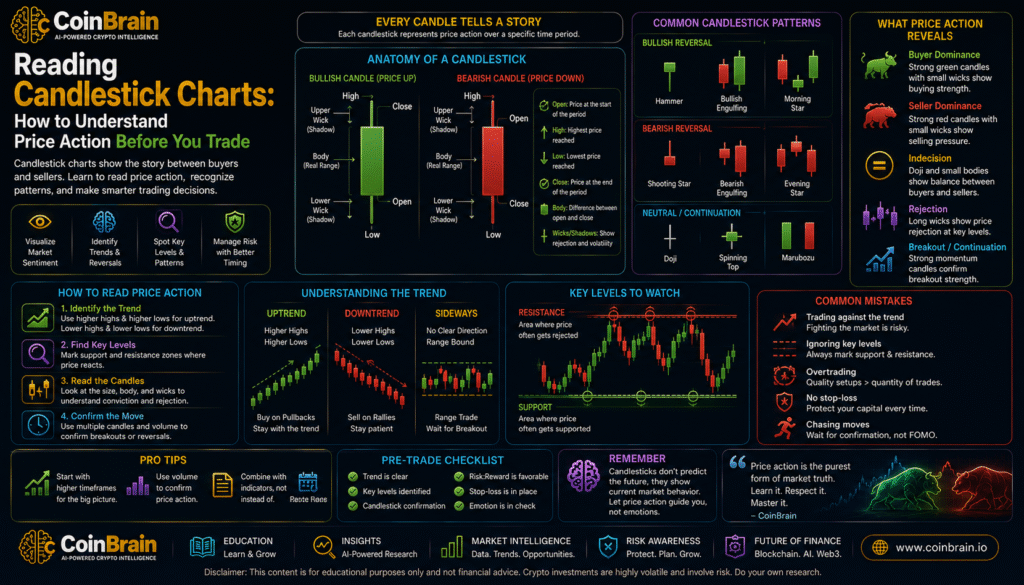
Step 8 — Read Candlesticks
Indicators do not replace price action.
If MACD turns bullish at support while a strong bullish candle forms, multiple pieces of evidence align.
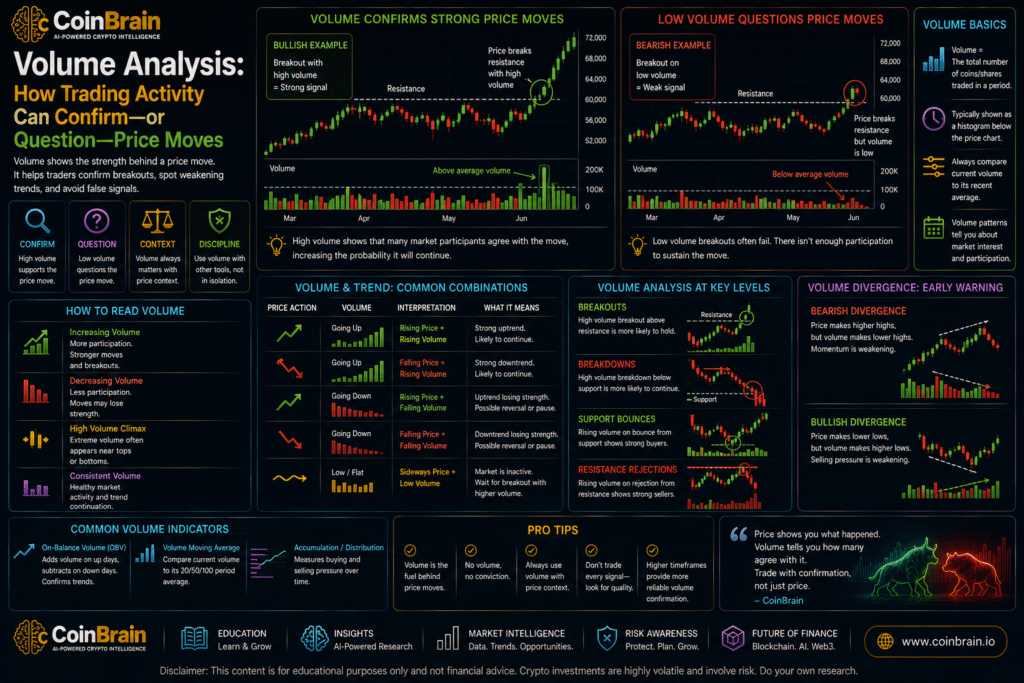
Step 9 — Check Volume
A breakout accompanied by:
bullish MACD + increasing volume
may be more convincing than a low-volume move.
Step 10 — Define Invalidation
Your stop should generally relate to:
price structure
rather than simply:
MACD crossed again.
Step 11 — Calculate Risk-to-Reward
Never enter simply because the indicator looks attractive.
Evaluate:
potential loss
versus:
potential reward.
Step 12 — Journal the Signal
Record:
- MACD condition
- price structure
- timeframe
- entry
- invalidation
- result
Over time, you can identify which setups work best within your trading process.
A Beginner Example
Suppose Bitcoin has been declining from:
$100,000
toward:
$90,000 support.
Price Structure
Support:
$89,000–$91,000
Candlestick
A daily candle forms with:
- long lower wick
- close near high
RSI
RSI begins recovering from:
31
toward:
40.
MACD Histogram
Negative bars become progressively smaller.
MACD
The MACD line then crosses above the signal line while both remain below zero.
What does this mean?
Not:
“Guaranteed Bitcoin rally.”
A better interpretation is:
Support is holding
buyers rejected lower prices
RSI momentum is recovering
MACD downside momentum is weakening
This provides a stronger technical case.
But because MACD remains below zero:
the larger trend may still require confirmation.
Suppose Bitcoin later breaks:
$95,000 resistance
and MACD crosses above zero.
The evidence supporting a broader trend change has become stronger.
This demonstrates how technical analysis should develop:
Evidence accumulates.
It should not depend on one indicator.
Example: MACD Whipsaw
Suppose Bitcoin trades sideways between:
$98,000–$102,000.
MACD produces:
Bullish crossover
then:
Bearish crossover
then:
Bullish crossover
within several days.
A trader executing every crossover incurs:
- losses
- fees
- frustration
The real problem is not MACD.
The problem is:
using a trend-following momentum indicator inside a directionless market without context.
MACD + Support and Resistance
A stronger bullish framework might be:
Major Support
Bullish Candlestick
MACD Momentum Improvement
Good Risk-to-Reward
A weaker framework is:
MACD crossed upward. Buy.
MACD + RSI
Suppose:
RSI:
28 → 35 → 45
while:
MACD histogram:
deep negative → smaller negative bars → positive
This suggests momentum is improving through two different mathematical perspectives.
Still:
price confirmation remains necessary.
The CoinBrain MACD Checklist
Before using MACD in a trade, ask:
Market Structure
- Uptrend, downtrend or range?
Location
- Is price near support or resistance?
Zero Line
- Is MACD above or below zero?
Signal Line
- Is MACD above or below its signal line?
Crossover
- Is the crossover recent?
Histogram
- Is momentum expanding or contracting?
Divergence
- Is MACD confirming new price highs or lows?
Timeframe
- Does the higher timeframe agree?
Candlesticks
- Does price action support the idea?
Volume
- Is participation confirming the move?
Invalidation
- What price action proves the thesis wrong?
Risk
- Is position size appropriate?
If the complete strategy is:
“Buy every bullish MACD crossover.”
the strategy is incomplete.
Business Implications
MACD also illustrates how trading platforms can evolve beyond simple indicator displays.
Traditional platforms show:
MACD Line
Signal Line
Histogram
A more intelligent system could interpret the relationship:
“MACD has crossed bullish on the four-hour chart, but remains below zero and the daily trend remains bearish.”
Or:
“Bitcoin’s daily MACD remains positive, but histogram contraction indicates momentum has weakened for five consecutive sessions.”
This creates an opportunity for:
AI-Assisted Technical Analysis
that educates rather than simply generating simplistic:
Buy
or:
Sell
signals.
12. Final Analysis
MACD teaches traders an important lesson:
Trend and momentum are connected—but they are not identical.
A market can remain in an uptrend while momentum begins weakening.
A downtrend can continue even while bearish momentum starts fading.
MACD helps visualize these transitions.
The:
MACD Line
shows the relationship between shorter and longer exponential moving averages.
The:
Signal Line
helps identify shifts in that relationship.
The:
Histogram
shows whether momentum is expanding or contracting.
The:
Zero Line
helps provide broader trend context.
Together, these create a useful framework.
But MACD is not a prediction machine.
A bullish crossover does not mean:
“Price must rise.”
A bearish crossover does not mean:
“Price must fall.”
Instead, ask:
Where did the crossover occur?
What is the broader trend?
Is price at support or resistance?
What are candlesticks showing?
Is momentum expanding?
Is volume confirming?
Where is the trade invalidated?
This connects the first four articles of our Learn Trading series.
Article 01 — Candlesticks
How is price behaving?
Article 02 — Support & Resistance
Where is that behavior occurring?
Article 03 — RSI
How strong is recent momentum?
Article 04 — MACD
How are momentum and trend evolving together?
We are gradually building a complete technical-analysis framework rather than collecting isolated indicators.
The central CoinBrain principle remains:
Indicators should confirm market understanding—not replace it.
MACD is most valuable when it helps traders recognize changes they can also explain through price structure.
That is the difference between:
following an indicator
and:
understanding a market.
13. References & Further Reading
Gerald Appel
Technical Analysis: Power Tools for Active Investors
Gerald Appel developed the Moving Average Convergence Divergence indicator and extensively documented moving-average and momentum-based market analysis.
CMT Association
Trend and Momentum Analysis
Professional technical-analysis resources covering moving averages, momentum, trend analysis and indicator confirmation.
Fidelity
Moving Average Convergence/Divergence — MACD
Educational material explaining MACD lines, signal-line crossovers, zero-line interpretation and divergence.
Charles Schwab
Technical Indicators and Momentum
Educational resources covering moving averages, momentum indicators and their use within broader technical-analysis frameworks.
TradingView
MACD — Moving Average Convergence Divergence
Charting documentation explaining MACD calculations, signal lines, histograms and customizable indicator settings.
Concepts for Further Study
Readers progressing beyond the fundamentals should investigate:
- Moving Average Convergence Divergence
- MACD 12-26-9
- exponential moving averages
- EMA
- MACD line
- signal line
- MACD histogram
- bullish crossover
- bearish crossover
- zero-line crossover
- bullish divergence
- bearish divergence
- momentum
- trend following
- moving-average convergence
- moving-average divergence
- whipsaw
- multi-timeframe analysis
- indicator lag
- technical confirmation
CoinBrain Learn Trading
Article 01 — Reading Candlestick Charts: How to Understand Price Action Before You Trade
Article 02 — Support and Resistance: How Traders Identify Important Price Levels
Article 03 — What Is RSI? Understanding Momentum, Overbought and Oversold Markets
Article 04 — What Is MACD? How Traders Read Momentum and Trend Changes
Next Article
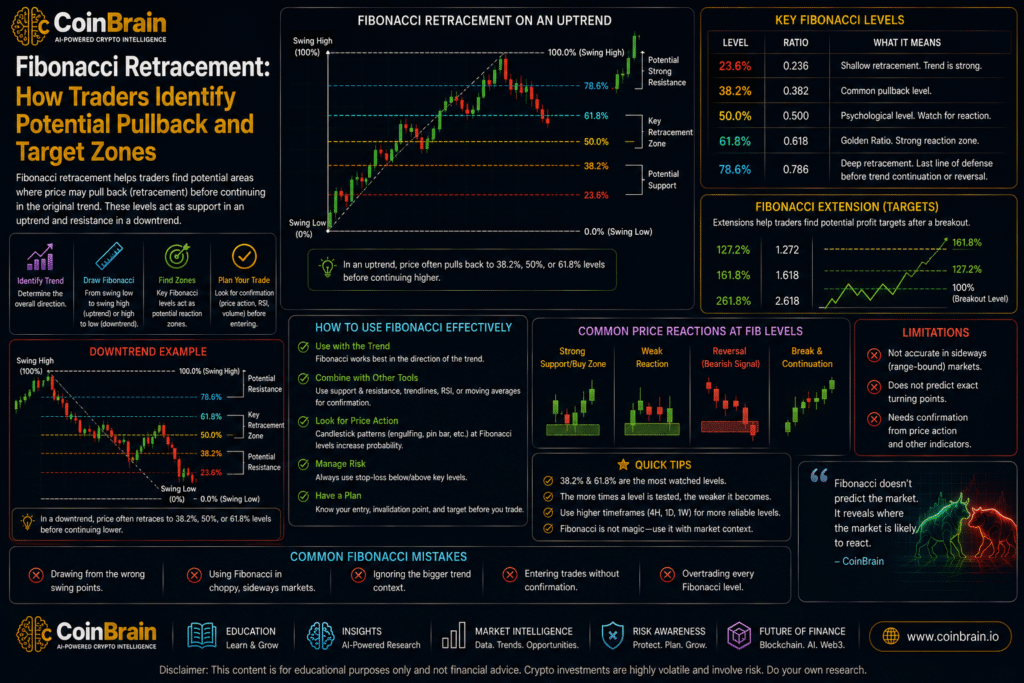
Article 05 — Fibonacci Retracement: How Traders Identify Potential Pullback and Target Zones
CoinBrain Research Articles
Research. Understand. Decide.

Leave a Reply
You must be logged in to post a comment.