
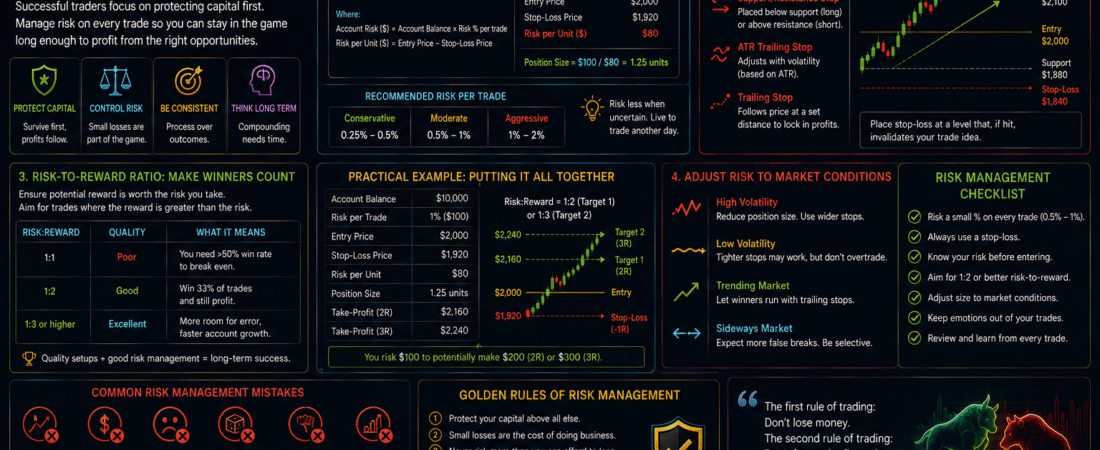

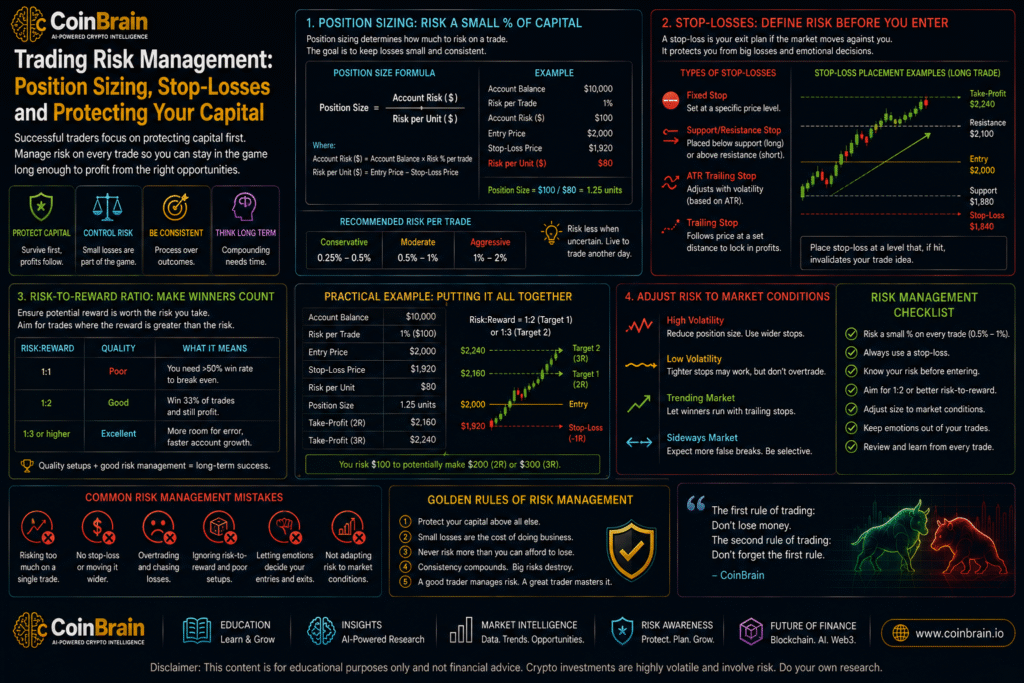
Trading Risk Management: Position Sizing, Stop-Losses and Protecting Your Capital
CoinBrain Research Articles | Learn Trading — Article 07
Updated: August 2026
A trader can be wrong frequently and still survive.
Another trader can be right frequently and still lose most of their capital.
The difference often comes down to:
Risk Management.
Technical analysis helps traders identify potential opportunities.
Candlesticks help interpret price behavior.
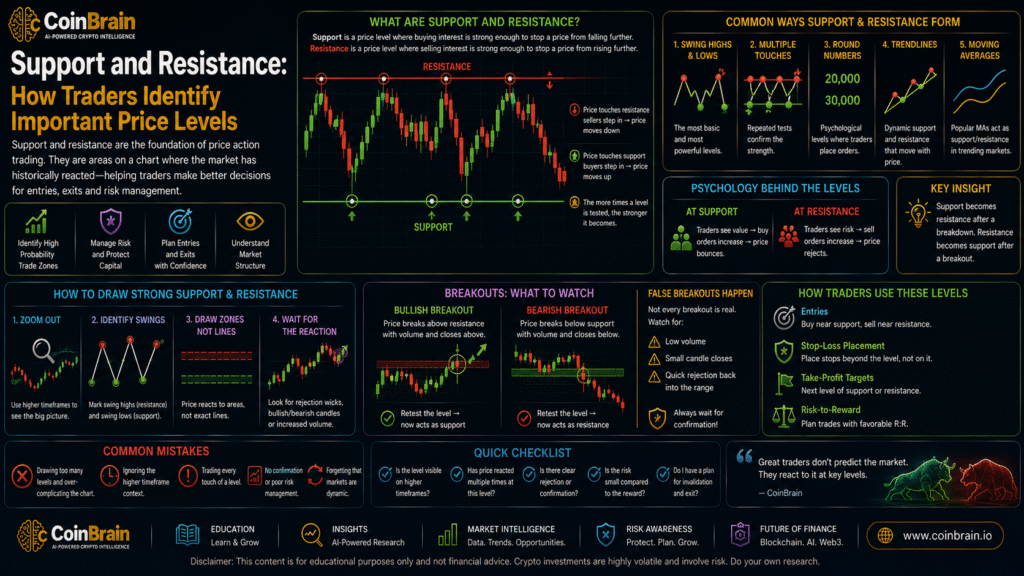
Support and resistance identify important market zones.
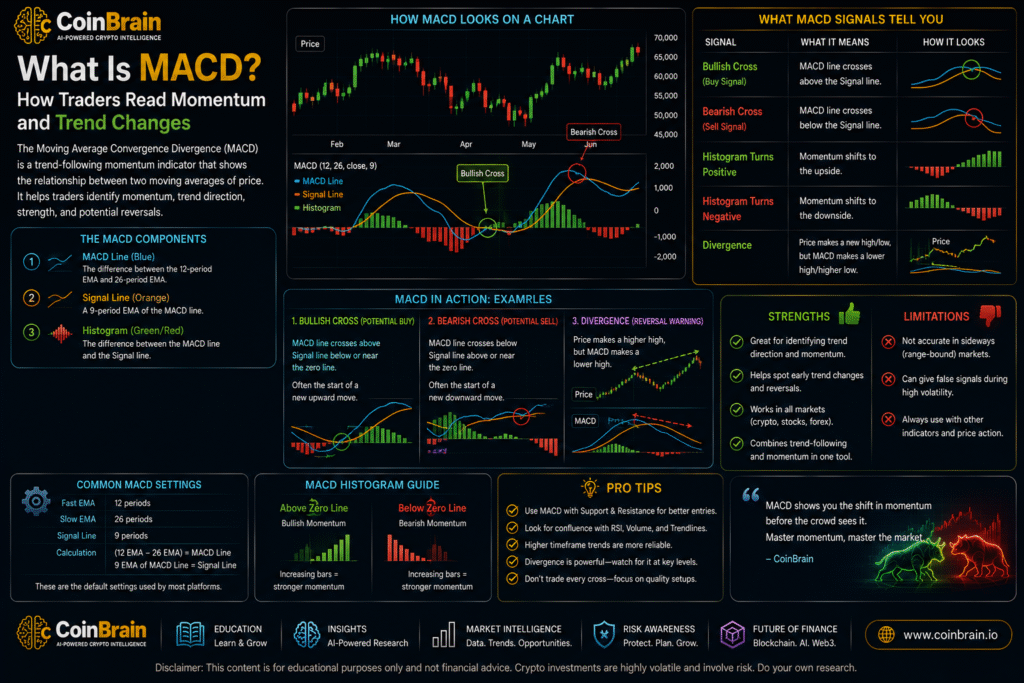
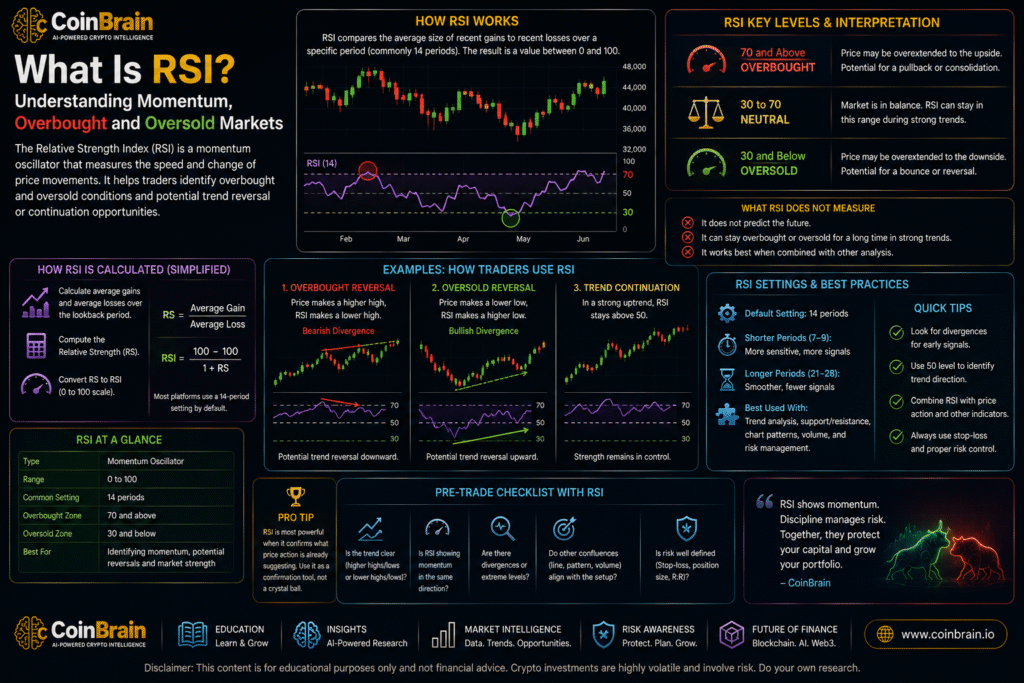
RSI and MACD help analyze momentum.
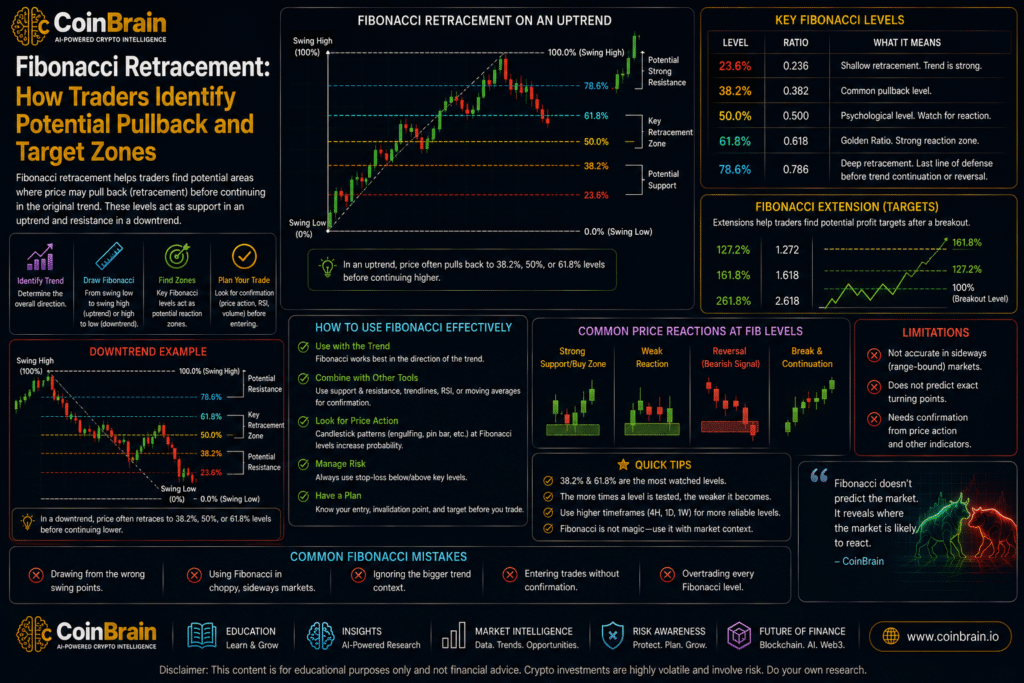
Fibonacci highlights potential retracement areas.
Volume helps evaluate participation.
But none of these tools can answer the most important question:
What happens to your portfolio when the trade is wrong?
Every trading strategy eventually produces losing trades.
No indicator eliminates uncertainty.
No chart pattern works every time.
No support level is guaranteed to hold.
No breakout is guaranteed to continue.
Professional trading therefore begins with an uncomfortable but essential assumption:
The next trade can fail.
Once that is accepted, trading decisions change.
Instead of asking only:
“How much can I make?”
the trader first asks:
“How much am I prepared to lose if my analysis is wrong?”
This leads to several fundamental concepts:
- position sizing
- stop-loss placement
- risk per trade
- risk-to-reward ratio
- portfolio exposure
- leverage management
- maximum drawdown
- diversification
- trade invalidation
- capital preservation
Risk management is not designed to prevent losses.
Losses are unavoidable.
Its purpose is to prevent:
ordinary losses from becoming catastrophic losses.
Educational Notice: This article is for educational and research purposes only and does not constitute financial or investment advice. Cryptocurrency trading can result in substantial or complete loss of capital. Leverage can magnify losses and may result in liquidation. Risk-management techniques can reduce certain risks but cannot eliminate them.
1. Executive Summary
Risk management is the process of controlling how much capital is exposed to potential loss.
The central principle is simple:
Never allow one trade to determine the future of your portfolio.
Suppose a trader has:
$10,000
and decides to risk:
1%
on one trade.
Maximum planned loss:
$100
This does not necessarily mean the trader buys only $100 worth of cryptocurrency.
Instead, the position size depends on:
- entry price
- stop-loss level
- distance between entry and stop
Suppose:
Entry:
$100
Stop:
$95
The trade risks:
5% per unit.
If the trader wants maximum portfolio risk of:
$100
then position size can be calculated accordingly.
This distinction is critical:
Position Size ≠ Amount at Risk
A trader might control a $2,000 position while only planning to risk $100 if the stop executes as intended.
Risk management also considers potential reward.
Suppose:
Entry:
$100
Stop:
$95
Target:
$115
Potential loss:
$5
Potential gain:
$15
Risk-to-reward:
1:3
This means the trader risks one unit to potentially earn three.
But risk/reward alone does not determine whether a strategy is profitable.
Profitability depends on:
Win Rate + Average Win + Average Loss + Costs + Execution
This leads to one of the most important ideas in trading:
You do not need to win every trade.
You need a process where losses remain controlled and successful trades compensate for unsuccessful ones over a sufficiently large sample.
2. Key Takeaways
1. Capital preservation comes before profit
Without capital, there is no next trade.
2. Every trade can fail
Risk management begins by accepting uncertainty.
3. Risk per trade should be defined before entry
Do not decide how much loss is acceptable after price moves against you.
4. Position size should depend on stop distance
A wider stop generally requires a smaller position if portfolio risk remains constant.
5. Stop-loss placement should follow market structure
Do not place stops at arbitrary percentages simply because they are convenient.
6. Risk-to-reward matters
Potential profit should be evaluated relative to potential loss.
7. Win rate alone does not determine profitability
A trader can win fewer than half of their trades and still potentially be profitable if average winners sufficiently exceed average losers.
8. Leverage magnifies both gains and losses
It does not improve the underlying trade setup.
9. Correlated positions can create hidden concentration
Owning several altcoins may still represent one large crypto-market bet.
10. Drawdowns become increasingly difficult to recover from
A 50% portfolio loss requires a 100% gain to return to the original capital level.
11. Stop-loss orders cannot guarantee the exact exit price
Slippage and gaps can create larger-than-planned losses.
12. Survival is part of the strategy
Good risk management allows traders to remain active long enough for a genuine edge to matter.
3. Market Overview
Why Traders Lose Capital
Trading losses can come from many sources:
- incorrect analysis
- unexpected news
- volatility
- false breakouts
- poor execution
- excessive leverage
- oversized positions
- emotional decisions
Being wrong is not necessarily the biggest problem.
Being:
too large while wrong
often is.
The Difference Between Investing and Trading Risk
A long-term investor may accept significant short-term volatility because the thesis is based on:
- adoption
- fundamentals
- valuation
- long-term growth
A trader usually operates differently.
The trade has:
- an entry
- a thesis
- an invalidation level
- often a target
If the technical reason for entering disappears, the trade should be reassessed.
This distinction is important.
Turning a failed short-term trade into:
“I am now a long-term investor”
is not risk management.
It is often avoidance of realizing a loss.
Crypto Makes Risk Management More Important
Crypto markets can experience:
- extreme volatility
- 24/7 trading
- rapid liquidations
- low-liquidity altcoins
- exchange risk
- smart-contract risk
- leverage
- sudden regulatory developments
A position can move dramatically while a trader is sleeping.
Risk management must therefore be designed:
before the volatility arrives.
Probability, Not Certainty
Suppose a strategy historically wins:
60%
of trades.
That still means approximately:
40% lose
within the observed sample.
Furthermore, losses may occur consecutively.
A trader must therefore survive:
losing streaks.
This is why risk per trade matters.
4. Technical Deep Dive
Risk Per Trade
Risk per trade represents the amount of portfolio capital that can be lost if the planned stop is executed around the expected level.
Suppose:
Portfolio:
$10,000
Risk per trade:
1%
Maximum planned risk:
$100
Formula:
Dollar Risk = Account Size × Risk Percentage
Therefore:
$10,000 × 0.01 = $100
Position Sizing
Now suppose:
Entry:
$100
Stop:
$95
Risk per unit:
$5
Maximum portfolio risk:
$100
Position size:
$100 ÷ $5 = 20 units
Position value:
20 × $100 = $2,000
So:
Position Value = $2,000
but:
Planned Risk = $100
This is one of the most important distinctions for beginners.
Position Size Formula
A simplified formula is:
Position Size = Maximum Dollar Risk ÷ Risk Per Unit
Where:
Risk Per Unit = Entry Price − Stop Price
for a simple long position.
Percentage-Based Example
Portfolio:
$20,000
Risk:
1% = $200
Entry:
$50
Stop:
$47.50
Stop distance:
5%
Risk per unit:
$2.50
Position size:
$200 ÷ $2.50 = 80 units
Position value:
80 × $50 = $4,000
Again:
$4,000 position
does not mean:
$4,000 planned loss.
The planned risk is approximately:
$200, before considering slippage, fees and other execution effects.
Stop-Loss
A stop-loss is an order or exit rule intended to close a position when price reaches a predefined level.
The purpose is:
to limit loss when the trade thesis becomes invalid.
Structural Stop Placement
Suppose support exists:
$90–$92
Entry:
$93
Placing a stop at:
$92.90
may be too close because ordinary volatility could trigger it.
A trader might instead identify:
Where does the market structure actually invalidate the trade?
Perhaps:
below $89
depending on the setup.
If this creates a wider stop:
reduce position size.
Do not increase risk simply because the technically appropriate stop is farther away.
Stop Distance and Position Size
This relationship is fundamental:
Wider Stop → Smaller Position
Tighter Stop → Larger Position
if dollar risk remains constant.
Risk-to-Reward Ratio
Suppose:
Entry:
$100
Stop:
$95
Target:
$110
Risk:
$5
Reward:
$10
Risk-to-reward:
1:2
Another setup:
Entry:
$100
Stop:
$95
Target:
$115
Risk:
$5
Reward:
$15
Risk-to-reward:
1:3
R-Multiple
Traders sometimes express results using:
R
where:
1R = initial planned risk.
If planned risk is:
$100
then:
Loss at stop:
−1R = −$100
Profit of $200:
+2R
Profit of $300:
+3R
This allows different trades to be compared consistently.
Win Rate and Risk-to-Reward
Imagine 10 trades.
Win rate:
40%
Therefore:
4 winners
6 losers
Suppose each loser:
−1R
Total losses:
−6R
Each winner:
+2R
Total gains:
+8R
Net:
+2R
Despite losing:
60% of trades
the hypothetical system produced positive gross expectancy before costs.
This demonstrates why:
Win Rate ≠ Profitability
by itself.
Expectancy
A simplified expectancy formula is:
Expectancy = (Win Rate × Average Win) − (Loss Rate × Average Loss)
Suppose:
Win rate:
45%
Average win:
2R
Loss rate:
55%
Average loss:
1R
Expectancy:
(0.45 × 2) − (0.55 × 1)
0.90 − 0.55 = +0.35R
The strategy has positive theoretical expectancy based on those assumptions.
Historical expectancy does not guarantee future performance.
Maximum Drawdown
Drawdown measures the decline from a portfolio peak to a subsequent low.
Suppose portfolio rises to:
$12,000
then falls to:
$9,000
Drawdown:
$3,000
or:
25%.
Monitoring drawdown helps traders understand whether losses remain within acceptable boundaries.
Recovery Mathematics
Losses have asymmetric recovery requirements.
10% Loss
$100 → $90
Required gain:
11.1%
20% Loss
$100 → $80
Required gain:
25%
50% Loss
$100 → $50
Required gain:
100%
75% Loss
$100 → $25
Required gain:
300%
This is why avoiding catastrophic losses is so important.
5. Current Industry Landscape
Risk management has become increasingly important as crypto markets have expanded into:
- spot trading
- perpetual futures
- options
- leveraged products
- DeFi
- institutional derivatives
The availability of leverage makes sophisticated risk controls essential.
Perpetual Futures
Crypto exchanges commonly offer perpetual contracts.
These allow traders to obtain leveraged exposure without holding the underlying asset directly.
Leverage can dramatically increase capital efficiency.
It can also dramatically increase liquidation risk.
Automated Risk Controls
Modern platforms increasingly provide:
- stop-loss orders
- take-profit orders
- trailing stops
- margin alerts
- liquidation-price estimates
These tools help traders manage positions but do not replace planning.
Portfolio Analytics
More sophisticated platforms provide:
- realized profit/loss
- unrealized profit/loss
- portfolio exposure
- historical drawdown
- volatility
- asset correlation
These metrics help move traders from:
trade-level thinking
toward:
portfolio-level risk management.
Crypto’s 24/7 Challenge
Traditional markets often close.
Crypto does not.
Risk controls must therefore function:
continuously.
This makes automated risk-management tools particularly important.
6. Institutional Activity
Professional trading organizations treat risk management as infrastructure rather than an optional trading feature.
A professional desk may monitor:
- position limits
- portfolio exposure
- volatility
- correlation
- liquidity
- drawdown
- counterparty risk
- concentration risk
before considering additional positions.
Position Limits
A trader may be prevented from exceeding predetermined exposure limits.
This reduces the chance that one conviction becomes an existential portfolio risk.
Value at Risk
Institutions may use:
Value at Risk — VaR
to estimate potential portfolio losses under defined statistical assumptions.
VaR has limitations and should not be interpreted as a maximum possible loss.
But it illustrates how professional risk management focuses on:
portfolio-level loss distributions.
Stress Testing
Institutions may ask:
What happens if Bitcoin falls 20%?
What happens if volatility doubles?
What happens if several correlated assets fall together?
These are:
stress scenarios.
Retail traders can use simplified versions of the same thinking.
Liquidity Risk
A position may look manageable until the trader attempts to exit.
Institutions therefore consider:
Can we actually sell this position at approximately the expected price?
This is especially important for small-cap crypto assets.
Counterparty Risk
Trading capital stored on an exchange creates another form of exposure:
counterparty risk.
Risk management therefore extends beyond chart setups.
It can include:
- exchange exposure
- custody
- stablecoin exposure
- smart-contract risk
7. Market Data & Metrics
Risk management becomes more disciplined when it is quantified.
1. Account Size
Total capital allocated to the trading strategy.
2. Risk Per Trade
Percentage or dollar amount that can be lost on one trade.
Example:
1%
3. Stop Distance
Difference between:
Entry
and:
Invalidation/Stop
4. Position Size
Calculated based on:
Risk Budget ÷ Stop Distance
5. Risk-to-Reward
Potential loss relative to potential gain.
6. Win Rate
Percentage of trades that produce positive outcomes.
Formula:
Winning Trades ÷ Total Trades × 100
7. Average Win
Average profit from winning trades.
8. Average Loss
Average loss from losing trades.
9. Expectancy
Estimated average outcome per trade based on historical strategy results.
10. Maximum Drawdown
Largest peak-to-trough decline observed in the portfolio.
11. Exposure
Total capital currently exposed to market movement.
12. Correlation
Measures how closely assets tend to move together.
Holding:
- Bitcoin
- Ethereum
- Solana
- several altcoins
may appear diversified.
During market stress, however, these positions can become highly correlated.
13. Leverage
Simplified:
Leverage = Position Exposure ÷ Trader Equity Supporting Position
Example:
Capital:
$1,000
Exposure:
$5,000
Approximate leverage:
5×
Higher leverage means smaller adverse price movements can cause substantial percentage losses relative to the supporting capital.
8. Real-World Use Cases
Use Case 1 — Position Sizing
Account:
$10,000
Risk:
1%
Maximum planned loss:
$100
Entry:
$100
Stop:
$95
Risk per unit:
$5
Position:
20 units
This is systematic risk management.
Use Case 2 — Wider Stop
Same account:
$10,000
Same risk:
$100
Entry:
$100
Stop:
$90
Risk per unit:
$10
Position size:
10 units
The stop doubled in width.
Therefore position size was cut in half.
Use Case 3 — Breakout Trade
Bitcoin breaks major resistance.
Technical setup appears strong:
- high volume
- bullish RSI
- positive MACD
The trader becomes extremely confident and risks:
20% of portfolio.
The breakout fails.
One analytical error causes major damage.
The problem was not necessarily the analysis.
It was:
position sizing.
Use Case 4 — Correlated Altcoins
A trader opens five positions:
2% risk each.
The trader thinks:
“Each trade risks only 2%.”
But all five are high-beta altcoins.
Bitcoin suddenly falls sharply.
All five positions decline simultaneously.
Potential portfolio risk becomes far greater than the trader mentally expected.
This is:
correlation risk.
Use Case 5 — Moving the Stop
Entry:
$100
Stop:
$90
Price reaches:
$91
Trader moves stop to:
$80
because:
“It will recover.”
Price falls to:
$81
Stop moves again.
A planned:
−1R
loss becomes:
−3R
or worse.
This destroys the mathematics of the strategy.
Use Case 6 — Scaling Out
A trader reaches the first target and closes part of the position.
Remaining exposure continues toward a second target.
Scaling can reduce risk while preserving some participation.
But the rules should ideally be defined before the trade rather than improvised emotionally.
Use Case 7 — No Trade
Setup:
excellent.
But:
Entry:
$100
Stop:
$90
Realistic resistance:
$105
Potential risk:
$10
Potential reward:
$5
Risk-to-reward:
1:0.5
The trader decides:
No trade.
Technical analysis identified an opportunity.
Risk analysis rejected it.
That is disciplined trading.
9. Risks & Challenges
Risk management itself has limitations and implementation challenges.
1. Stop-Loss Slippage
A stop at:
$90
does not guarantee execution at exactly $90.
During rapid markets, the actual exit may be:
$89
$87
or lower.
2. Market Gaps and Liquidity Events
Crypto trades continuously, but liquidity can still disappear suddenly.
Thin markets can move rapidly between prices.
3. Excessive Leverage
Leverage compresses the distance between normal volatility and catastrophic loss.
4. Stops Too Tight
Very tight stops can be triggered by ordinary market noise.
5. Stops Too Wide
Extremely wide stops may create unnecessary losses if position size is not reduced appropriately.
6. Arbitrary Stop Placement
A stop should ideally correspond to:
trade invalidation
not:
the amount the trader emotionally feels comfortable losing.
The amount at risk is then controlled through position size.
7. Revenge Trading
After a loss, a trader increases position size to:
“win the money back.”
This can turn one loss into a series of increasingly large losses.
8. Overconfidence After Winning Streaks
Several successful trades can create the belief:
“My strategy cannot fail.”
Risk suddenly increases.
Then one normal losing trade causes disproportionate damage.
9. Ignoring Correlation
Several positions can effectively represent one market exposure.
10. Ignoring Fees and Funding
Frequent trading can incur:
- transaction fees
- spreads
- slippage
- perpetual funding
These reduce realized expectancy.
11. Assuming Stops Eliminate Risk
Stops reduce certain risks.
They do not eliminate:
- slippage
- exchange failure
- connectivity problems
- extreme volatility
- execution failure
12. Changing Rules Mid-Trade
Risk plans become ineffective when traders abandon them as soon as emotions increase.
10. Future Outlook: 3–5 Years
Risk management is likely to become one of the areas where AI and automation provide substantial value to retail traders.
Automatic Position Sizing
A trader could specify:
Portfolio Risk = 1%
Then identify:
Entry
and:
Invalidation
The platform automatically calculates appropriate position size.
Portfolio-Level Risk Engines
Instead of evaluating each trade independently, systems may analyze:
- total exposure
- asset correlation
- leverage
- volatility
before allowing another position.
AI Risk Warnings
A platform could warn:
“This trade risks 1% individually, but your existing correlated altcoin positions could increase combined downside exposure significantly.”
This is far more useful than a simple stop-loss calculator.
Dynamic Volatility Adjustment
Position size could automatically adjust based on current volatility.
Higher volatility:
smaller position.
Lower volatility:
potentially larger position for the same defined risk budget.
Behavioral Risk Monitoring
AI systems may identify patterns such as:
- increasing size after losses
- excessive trade frequency
- repeatedly moving stops
- deteriorating risk/reward
and alert the trader.
Stress Testing for Retail Portfolios
Platforms may automatically simulate:
BTC −10%
ETH −15%
Altcoins −25%
and estimate portfolio impact.
Tools once associated primarily with institutional risk desks may become increasingly accessible.
11. Investment & Trading Implications
A disciplined trader can build risk management into every trade.
Step 1 — Define Trading Capital
Separate:
capital allocated to trading
from money needed for:
- living expenses
- emergencies
- near-term obligations
Trading capital should be capital the trader can financially tolerate losing.
Step 2 — Define Risk Per Trade
Choose a consistent risk framework appropriate to personal circumstances and strategy.
For educational examples, traders often discuss figures such as:
0.5%
or:
1%
per trade.
These are examples—not universal recommendations.
Step 3 — Identify the Setup
Use:
- candlesticks
- support/resistance
- RSI
- MACD
- Fibonacci
- volume
to develop the trade thesis.
Step 4 — Identify Invalidation
Ask:
What price behavior proves this trade thesis wrong?
This should come before position sizing.
Step 5 — Determine Stop Distance
Calculate:
Entry − Stop
for a long position.
Step 6 — Calculate Position Size
Use:
Maximum Dollar Risk ÷ Risk Per Unit
Step 7 — Identify Potential Target
Use:
- next resistance
- previous high
- market structure
- measured move
- Fibonacci extension
where appropriate.
Step 8 — Calculate Risk-to-Reward
Determine whether the opportunity justifies the potential loss.
Step 9 — Check Portfolio Exposure
Ask:
Do I already have several positions that depend on the same market direction?
Step 10 — Check Leverage
Understand:
- liquidation price
- margin requirements
- funding costs
- downside exposure
before entering leveraged trades.
Step 11 — Place the Trade According to Plan
Avoid improvising once emotions increase.
Step 12 — Record the Outcome
Track:
- planned risk
- actual loss/profit
- slippage
- R-multiple
- whether rules were followed
This separates:
strategy performance
from:
execution discipline.
A Complete Beginner Example
Suppose a trader has:
$10,000
Trading rule:
Maximum planned risk:
1%
Therefore:
Risk Budget = $100
Bitcoin setup:
Support
$90,000–$92,000
Entry
$93,000
Invalidation
$89,000
Risk per BTC:
$4,000
Maximum position size:
$100 ÷ $4,000
=
0.025 BTC
Approximate position value at $93,000:
$2,325
Now suppose target:
$101,000
Potential reward per BTC:
$8,000
Risk:
$4,000
Potential risk-to-reward:
1:2
The trade thesis might also include:
Candlestick
Bullish rejection from support.
RSI
Recovering from oversold territory.
MACD
Negative histogram contracting.
Fibonacci
50% retracement overlaps support.
Volume
Buying activity increases on the rebound.
This creates a technically interesting setup.
But the most important number is still:
Maximum planned portfolio loss ≈ $100, subject to execution and slippage.
If the setup fails:
the trader retains approximately:
99% of the starting portfolio before fees/slippage and other positions.
The trader can continue.
That is the purpose of risk management.
The Mathematics of Losing Streaks
Suppose a trader risks:
1% of current capital
per trade and experiences five consecutive full-risk losses.
Starting capital:
$10,000
After approximately five sequential 1% losses:
capital remains around:
$9,510
before costs, depending on whether risk is recalculated from current equity.
Now imagine risking:
20%
per trade.
Five consecutive 20% losses on remaining equity would leave only about:
32.8% of the starting capital
before costs.
The strategy might be identical.
The position sizing created radically different survival outcomes.
Risk Management and Win Rate
Imagine two traders.
Trader A
Win rate:
70%
Average winner:
+1R
Average loser:
−4R
Over 10 representative trades:
7 wins:
+7R
3 losses:
−12R
Net:
−5R
Trader B
Win rate:
40%
Average winner:
+3R
Average loser:
−1R
Over 10 representative trades:
4 wins:
+12R
6 losses:
−6R
Net:
+6R
These simplified examples demonstrate:
Being right more often does not necessarily mean making more money.
The size of wins and losses matters.
Portfolio Risk
Suppose a trader has:
BTC Long
Risk:
1%
ETH Long
Risk:
1%
SOL Long
Risk:
1%
AVAX Long
Risk:
1%
LINK Long
Risk:
1%
Nominally:
five different trades.
But during a broad crypto selloff, all may move together.
The portfolio may effectively contain:
one large directional crypto trade.
Risk management therefore needs two levels:
Trade-Level Risk
and:
Portfolio-Level Risk.
Leverage Example
Suppose a trader has:
$1,000
and uses it to control:
$10,000
of market exposure.
Approximate leverage:
10×
A relatively small adverse market move can create a very large percentage loss relative to the trader’s supporting capital, and liquidation mechanics can make the outcome even more severe.
Leverage does not create:
better analysis.
It creates:
greater exposure.
This distinction should never be forgotten.
The CoinBrain Risk Management Checklist
Before entering any trade, ask:
Capital
- What is my total trading capital?
Risk
- How much can this trade lose?
Percentage
- What percentage of my portfolio does that represent?
Entry
- Where am I entering?
Invalidation
- What proves the thesis wrong?
Stop
- Where is the planned exit?
Position Size
- Does the position size match the risk budget?
Target
- Where is the realistic profit objective?
Risk-to-Reward
- Is the potential reward worth the risk?
Correlation
- Do I already hold similar market exposure?
Leverage
- Am I using leverage, and do I understand its effect?
Liquidity
- Can the position realistically be exited?
Costs
- Have I considered fees, spreads, slippage and funding?
Psychology
- Am I following the plan or reacting emotionally?
If you cannot answer:
“How much will I lose if this trade fails?”
you are not ready to enter the trade.
A Simple CoinBrain Trade Framework
Before entering:
1. Identify Setup
↓
2. Identify Invalidation
↓
3. Calculate Stop Distance
↓
4. Define Risk Budget
↓
5. Calculate Position Size
↓
6. Determine Target
↓
7. Evaluate Risk-to-Reward
↓
8. Check Portfolio Exposure
↓
9. Execute
↓
10. Review
Notice something important:
Position size comes after invalidation.
Do not decide:
“I want to buy $5,000 worth.”
and then search for a convenient stop.
Instead:
“This setup becomes invalid below this price. Given that distance, what position size keeps my risk within my limit?”
That is a much more disciplined process.
Business Implications
Risk management is also a major opportunity for modern trading platforms.
Most platforms make it extremely easy to:
buy
and:
sell.
Far fewer make it equally easy to understand:
risk before clicking Buy.
A more intelligent trading platform could automatically display:
Account Capital: $10,000
Entry: $100
Stop: $95
Risk Budget: 1%
Suggested Maximum Position Based on Defined Risk: $2,000
Potential Target: $115
Risk-to-Reward: 1:3
Current Correlated Exposure: Elevated
Portfolio Drawdown: 4.2%
AI could add context:
“Your planned trade risks approximately 1% individually, but three existing altcoin positions are strongly exposed to the same broader crypto-market direction.”
This changes the role of trading technology from:
order execution
toward:
decision support and risk awareness.
For newcomers especially, this may be one of the most valuable applications of AI in trading.
12. Final Analysis
Risk management is not the most exciting part of trading.
There are no dramatic predictions.
No perfect indicators.
No secret chart patterns.
But it may be the most important skill in the entire Learn Trading series.
Technical analysis asks:
Where could the market go?
Risk management asks:
What happens if I am wrong?
That second question determines survival.
A trader does not control:
- Bitcoin’s next candle
- market news
- institutional flows
- volatility
- whether support holds
But a trader can exercise substantial control over:
- position size
- planned risk
- leverage
- portfolio exposure
- entry discipline
- exit discipline
This distinction is fundamental.
Our technical framework has now developed significantly.
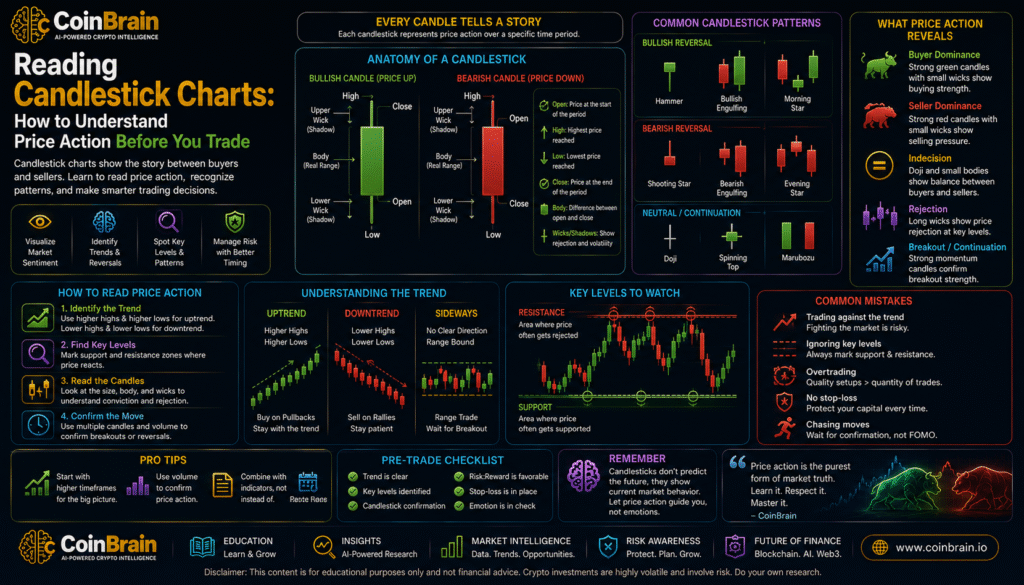
Article 01 — Candlesticks
How is price behaving?
Article 02 — Support & Resistance
Where is price reacting?
Article 03 — RSI
How strong is momentum?
Article 04 — MACD
How are momentum and trend evolving?
Article 05 — Fibonacci
Where might a pullback find an important reaction zone?
Article 06 — Volume
How much participation supports the move?
Article 07 — Risk Management
How much can we afford to lose if all of that analysis is wrong?
The final question is arguably the most important.
A strong setup can fail.
A weak setup can unexpectedly succeed.
Trading is probabilistic.
The objective is therefore not:
Never lose.
The objective is:
Keep losses controlled, protect capital and allow a genuine trading edge enough opportunities to express itself over time.
This leads to one of the most important principles in the CoinBrain Learn Trading series:
Your first job as a trader is not to make money on the next trade. It is to make sure one wrong trade cannot remove you from the game.
Capital creates future opportunity.
Protecting it is not separate from trading.
It is trading.
13. References & Further Reading
CME Group
Risk Management and Futures Education
Educational resources covering leverage, position exposure, margin, risk management and derivatives trading.
CMT Association
Technical Analysis and Trading Risk
Professional technical-analysis resources addressing trading systems, risk controls, position management and disciplined execution.
FINRA
Margin and Investment Risk
Investor education concerning leverage, margin exposure and the potential for amplified losses.
U.S. Commodity Futures Trading Commission — CFTC
Customer Education and Risk
Educational resources explaining speculative trading risks, leverage, derivatives and fraud awareness.
CFA Institute
Portfolio and Risk Management
Professional resources covering portfolio risk, diversification, volatility, drawdowns and investment risk frameworks.
Concepts for Further Study
Readers progressing beyond the fundamentals should investigate:
- position sizing
- risk per trade
- stop-loss
- invalidation
- risk-to-reward ratio
- R-multiple
- trading expectancy
- win rate
- average win
- average loss
- maximum drawdown
- portfolio exposure
- correlation
- diversification
- leverage
- margin
- liquidation
- slippage
- liquidity risk
- counterparty risk
- volatility-adjusted position sizing
- portfolio stress testing
CoinBrain Learn Trading
Article 01 — Reading Candlestick Charts: How to Understand Price Action Before You Trade
Article 02 — Support and Resistance: How Traders Identify Important Price Levels
Article 03 — What Is RSI? Understanding Momentum, Overbought and Oversold Markets
Article 04 — What Is MACD? How Traders Read Momentum and Trend Changes
Article 05 — Fibonacci Retracement: How Traders Identify Potential Pullback and Target Zones
Article 06 — Volume Analysis: How Trading Activity Can Confirm—or Question—Price Moves
Article 07 — Trading Risk Management: Position Sizing, Stop-Losses and Protecting Your Capital
Next Article
Article 08 — Trading Psychology: How Fear, Greed and Discipline Influence Trading Decisions
CoinBrain Research Articles
Research. Understand. Decide.
Leave a Reply
You must be logged in to post a comment.