

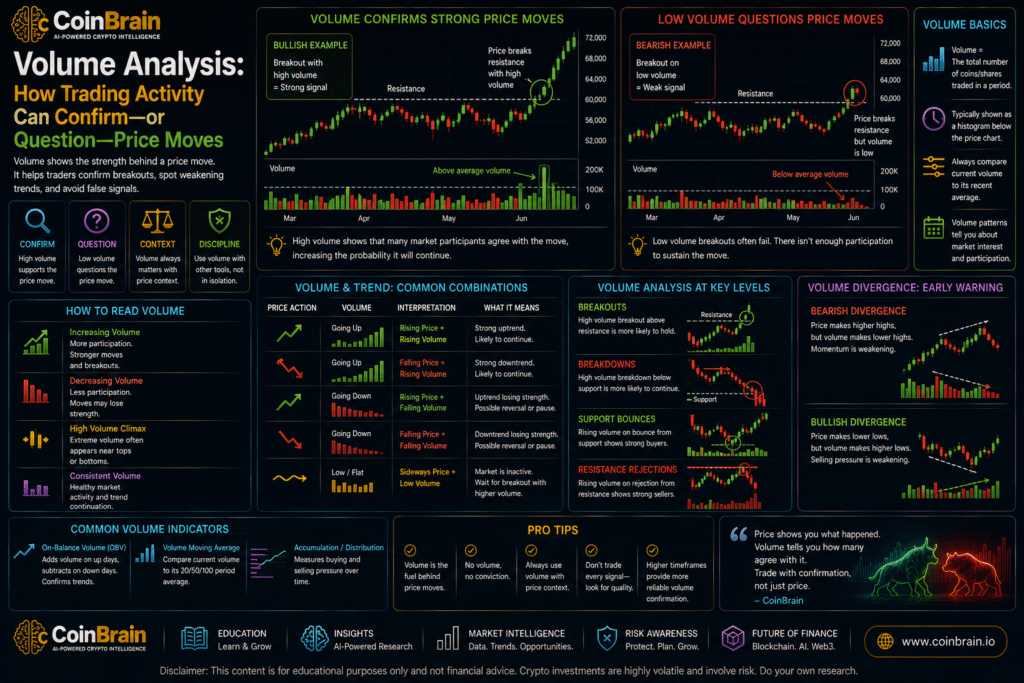
Volume Analysis: How Trading Activity Can Confirm—or Question—Price Moves
CoinBrain Research Articles | Learn Trading — Article 06
Updated: August 2026
Price tells us where the market moved.
Volume helps us understand how much participation was behind that move.
This distinction is important.
Imagine Bitcoin breaks above a major resistance level.
In one case, the breakout occurs with sharply rising trading volume.
In another, price moves above resistance while volume remains weak.
The price change may look similar.
The market participation behind it is not.
Volume measures the amount of trading activity that occurred during a particular period. Traders use it to evaluate whether buyers and sellers are participating strongly enough to support a price move.
Volume can help answer questions such as:
- Is a breakout attracting meaningful participation?
- Is a rally losing conviction?
- Is selling pressure accelerating?
- Did a support level attract strong buying activity?
- Is price moving because of broad participation or thin liquidity?
- Is a trend strengthening or becoming exhausted?
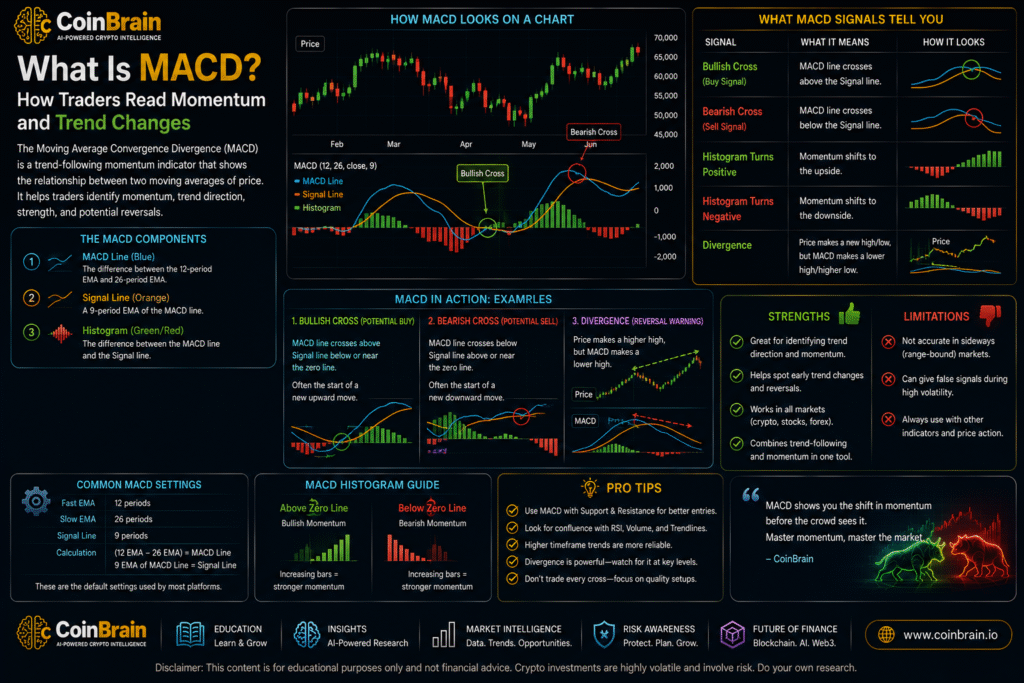
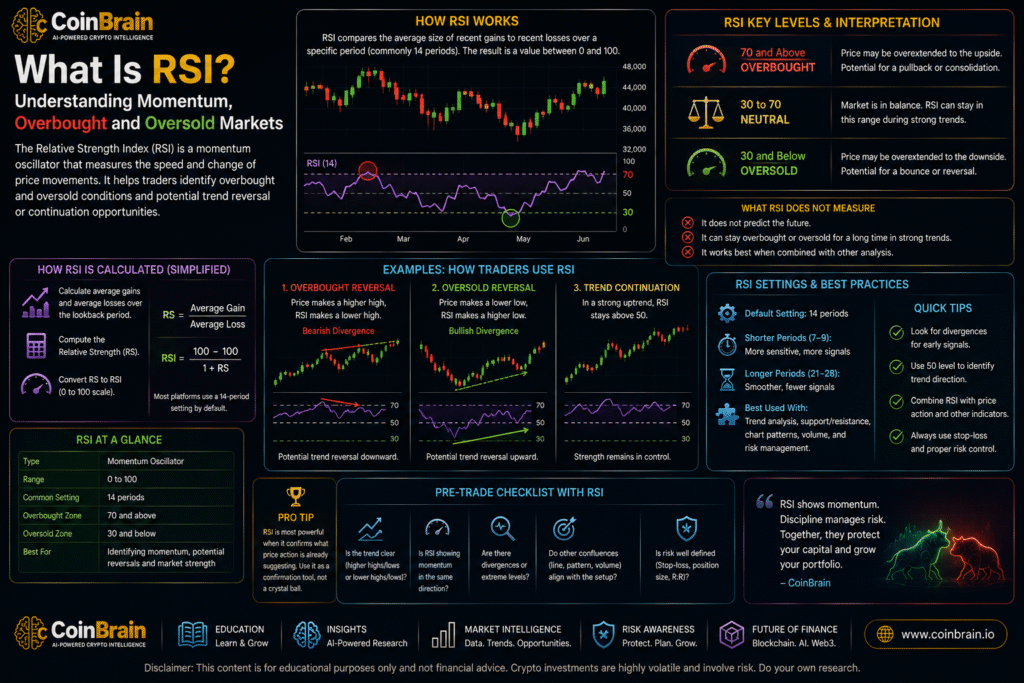
Volume is especially valuable because many technical indicators—including RSI and MACD—are derived primarily from price.
Volume adds another dimension:
Participation.
But volume must also be interpreted carefully.
High volume is not automatically bullish.
Low volume is not automatically bearish.
A large red candle on high volume may represent aggressive selling.
A sharp rebound on high volume may indicate substantial demand.
And in cryptocurrency, volume data can differ significantly across exchanges and between:
- spot markets
- perpetual futures
- decentralized exchanges
The key is therefore not simply:
“Is volume high?”
The better question is:
“What is price doing, and how does the volume behind that move compare with normal market activity?”
Educational Notice: This article is for educational and research purposes only. It does not constitute financial or investment advice. Volume analysis and other technical tools do not guarantee future market movements. Cryptocurrency trading can result in substantial losses, particularly when leverage is used.
1. Executive Summary
Trading volume measures how much of an asset is traded during a particular period.
If a one-hour Bitcoin candle records substantial buying and selling activity, its volume will generally be higher than a candle during a quiet trading period.
Volume becomes especially useful when evaluated together with price.
A simplified framework is:
Price Movement + Volume = Strength of Participation
For example:
Price Rising + Volume Rising
Can indicate increasing participation behind the upward move.
Price Rising + Volume Falling
May suggest the rally is losing participation.
Price Falling + Volume Rising
Can indicate aggressive selling or capitulation.
Price Falling + Volume Falling
May indicate declining selling interest.
These interpretations are not universal rules.
Context matters.
Traders commonly use volume to analyze:
- breakouts
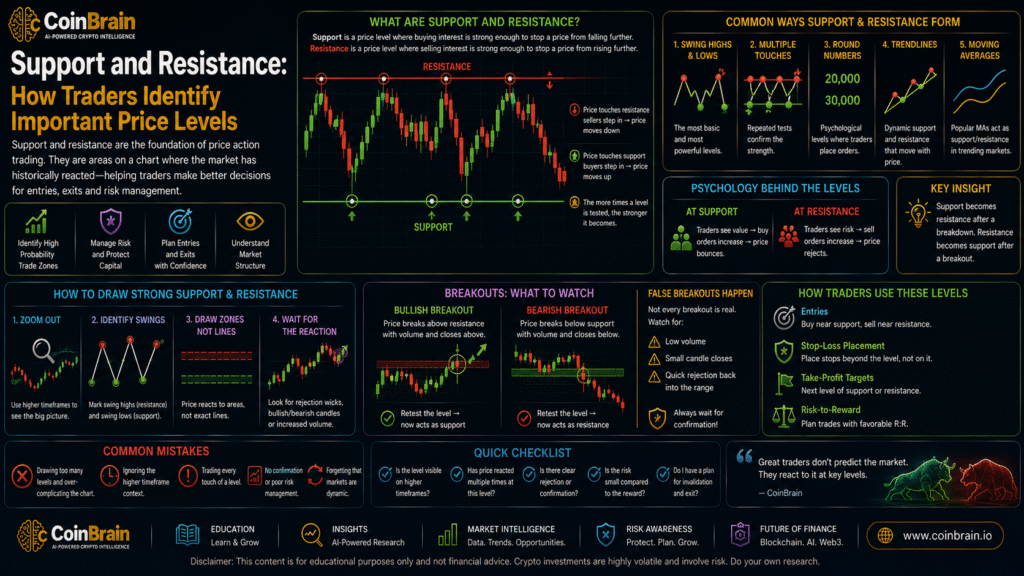
- support and resistance
- trend continuation
- reversals
- accumulation
- distribution
- capitulation
- liquidity
- market participation
Volume can also be examined through tools such as:
- volume bars
- moving-average volume
- volume profile
- On-Balance Volume
- VWAP
However, beginners should first master the basic relationship between:
Price + Volume + Market Structure.
2. Key Takeaways
1. Volume measures market activity
It tells traders how much trading occurred during a period.
2. Price shows direction; volume shows participation
They should generally be analyzed together.
3. Rising price with rising volume can strengthen a bullish move
More participants appear to be supporting the advance.
4. Falling price with rising volume can indicate strong selling pressure
But it can also appear during capitulation near a market bottom.
5. Breakouts are often more convincing when volume expands
Low-volume breakouts can deserve additional caution.
6. Volume should be compared with recent history
A raw volume number has little meaning without context.
7. High volume does not automatically mean bullish
Every transaction involves both a buyer and a seller.
Price behavior tells us which side was more aggressive.
8. Crypto volume is fragmented
Bitcoin trades on many centralized and decentralized venues.
No single exchange necessarily represents the entire market.
9. Spot and derivatives volume are different
A large futures market can create significant activity without equivalent spot buying.
10. Volume profile analyzes activity by price rather than only by time
This can help identify areas where large amounts of trading occurred.
11. Volume indicators are supporting tools
They should not replace market structure or risk management.
12. Volume can help identify conviction—but not certainty
Even a high-volume breakout can fail.
3. Market Overview
What Is Trading Volume?
Suppose during one hour:
10,000 BTC
changes hands across a market.
That represents significantly more activity than an hour during which:
1,000 BTC
is traded.
Charting platforms typically display volume as vertical bars beneath price candles.
Each bar corresponds to the same timeframe as the candle above it.
For example:
Daily Chart
Each volume bar represents approximately one day’s trading activity.
Four-Hour Chart
Each volume bar represents four hours.
Fifteen-Minute Chart
Each bar represents fifteen minutes.
Why Volume Matters
Suppose Bitcoin rises from:
$95,000 → $100,000
on unusually strong volume.
This may indicate substantial market participation.
Now imagine the same rise occurs during:
very low volume.
The market may be moving through thin liquidity with less broad conviction.
This does not automatically make the low-volume rally false.
But it changes the context.
Buyers and Sellers Always Exist
A common misconception is:
“High buying volume means there were more buyers than sellers.”
Every completed trade requires:
a buyer
and:
a seller.
What changes is the aggressiveness of participants.
If buyers repeatedly accept higher asking prices, price tends to rise.
If sellers aggressively hit available bids, price tends to fall.
Volume measures how much activity occurred during that process.
Volume and Liquidity
Volume and liquidity are related but different concepts.
Volume
How much was traded.
Liquidity
How easily an asset can be bought or sold without causing substantial price movement.
An asset can occasionally produce high volume while still having relatively poor market depth.
Professional traders therefore consider:
- volume
- order-book depth
- spreads
- slippage
together.
4. Technical Deep Dive
Basic Price-Volume Relationships
A simple analytical framework contains four combinations.
Scenario 1 — Price Up + Volume Up
Example:
Price:
$90 → $100
Volume:
significantly above recent average.
Possible interpretation:
stronger participation supports the advance.
This can be especially useful during a breakout.
Scenario 2 — Price Up + Volume Down
Price continues rising, but fewer participants appear involved.
Possible interpretation:
momentum may be weakening.
This does not mean price must reverse immediately.
Strong trends can continue temporarily on declining volume.
Scenario 3 — Price Down + Volume Up
Price falls while trading activity expands.
Possible interpretation:
selling pressure is significant.
During severe market declines, however, very high volume can also mark:
capitulation
where panicked holders sell aggressively into stronger buyers.
Context matters enormously.
Scenario 4 — Price Down + Volume Down
Price declines while activity diminishes.
Possible interpretation:
selling pressure may be weakening.
During a healthy uptrend, this can describe an ordinary low-volume pullback.
Volume Relative to Average
Instead of asking:
“Is 10 billion dollars of volume high?”
ask:
“How does today’s volume compare with recent activity?”
A trader might compare current volume with a:
20-period average volume.
Example:
Average daily volume:
$5 billion
Current:
$9 billion
Current volume is approximately:
80% above average.
That provides useful context.
Breakout Volume
Suppose resistance exists at:
$100.
Breakout A
Price closes at:
$105
Volume:
180% of recent average.
Breakout B
Price closes at:
$105
Volume:
60% of recent average.
Breakout A may demonstrate stronger participation.
But neither guarantees continuation.
Volume on Pullbacks
During an uptrend, traders may prefer to see:
Rally → Higher Volume
followed by:
Pullback → Lower Volume
This can suggest selling during the correction is relatively weak.
Then:
Breakout → Higher Volume
can provide additional confirmation.
Volume Climax
Very high volume after an extended move can sometimes indicate exhaustion.
Example:
Bitcoin falls aggressively for several weeks.
Then one day produces:
- enormous volume
- large lower wick
- strong recovery
This can indicate:
capitulation.
Many weak holders may have sold while stronger buyers absorbed supply.
But a volume spike by itself cannot confirm a bottom.
Volume Profile
Traditional chart volume measures:
Volume by Time
Volume Profile measures:
Volume by Price.
Instead of asking:
“How much traded today?”
it asks:
“At which prices did the most trading occur?”
This can reveal important market structure.
High-Volume Nodes
A:
High-Volume Node
is a price region where substantial trading occurred.
This may indicate:
market acceptance.
Price can spend considerable time around such areas.
Low-Volume Nodes
A:
Low-Volume Node
represents a region where comparatively little trading occurred.
Price can sometimes move rapidly through these zones because less historical trading interest exists there.
Point of Control
Volume Profile commonly identifies the:
Point of Control — POC
This is the price level within the selected range where the greatest volume occurred.
Traders may use it as an important reference area.
On-Balance Volume — OBV
OBV is a cumulative volume indicator.
In simplified terms:
If price closes higher:
add volume.
If price closes lower:
subtract volume.
Traders use OBV to evaluate whether volume trends confirm price trends.
Example:
Price makes:
higher highs
and OBV also makes:
higher highs.
This can confirm participation.
If price makes new highs while OBV fails to do so, traders may investigate possible weakening participation.
Volume Weighted Average Price — VWAP
VWAP combines price and volume to estimate the average trading price weighted by volume.
Conceptually:
VWAP = Total Price × Volume Contribution ÷ Total Volume
Institutional traders often use VWAP as an execution benchmark.
Intraday traders may also treat VWAP as a dynamic reference point.
5. Current Industry Landscape
Volume analysis is fundamental across modern markets.
It is used in:
- equities
- futures
- commodities
- crypto
- decentralized exchanges
But crypto creates several special challenges.
Fragmented Exchanges
Bitcoin does not trade on one central exchange.
It trades across:
- Coinbase
- Binance
- Kraken
- institutional venues
- decentralized markets
- many other exchanges
Therefore:
Bitcoin volume on one venue ≠ total Bitcoin market volume.
Spot vs Futures
Crypto derivatives can generate enormous trading volume.
But:
Futures Volume
is not identical to:
Spot Demand.
A trader can create substantial derivative exposure without purchasing equivalent quantities of the underlying cryptocurrency.
For market analysis, traders may therefore compare:
- spot volume
- perpetual volume
- futures volume
Decentralized Exchange Volume
DeFi also creates on-chain trading activity through DEXs.
This volume can be observed directly from blockchain transactions.
Wash Trading and Data Quality
Not all reported crypto trading volume is equally reliable.
Some venues may historically have reported activity that does not reflect genuine organic trading.
For research, high-quality data sources and reputable venues matter.
Institutional Market Growth
As regulated derivatives and institutional trading have expanded, professional crypto volume has become increasingly significant.
This means volume analysis now spans both:
Crypto-Native Markets
and:
Traditional Financial Infrastructure.
6. Institutional Activity
Institutional traders pay enormous attention to volume and liquidity.
For a large fund, an investment idea may be attractive but impossible to execute if sufficient liquidity does not exist.
Market Impact
Suppose a fund wants to buy:
$500 million
of an asset.
If daily volume is only:
$20 million
executing the order could dramatically move price.
Therefore institutions analyze:
- average daily volume
- market depth
- spreads
- execution costs
VWAP Execution
Institutions may divide large orders throughout the trading session to execute near:
Volume Weighted Average Price.
The objective is to reduce:
- market impact
- slippage
Volume Participation
Professional execution algorithms may target a percentage of market volume.
For example:
Participate at 5% of observed volume.
As trading activity increases, the algorithm can execute more.
Breakouts
Institutional traders may examine whether breakouts are supported by:
- substantial spot volume
- derivatives activity
- changes in open interest
- order flow
This provides deeper context than visual chart volume alone.
Accumulation and Distribution
Large investors cannot usually buy huge positions with one order.
Accumulation may occur gradually.
Likewise, distributing a large position requires finding buyers.
Volume analysis can sometimes help traders identify these periods, although inferring specific institutional behavior from chart patterns alone is uncertain.
7. Market Data & Metrics
Volume analysis can include several measurements.
1. Raw Volume
Amount traded during a period.
Example:
50,000 BTC
or:
$5 billion notional volume.
2. Average Volume
Calculate typical trading activity over a lookback period.
Example:
20-Day Average Volume
This provides a benchmark.
3. Relative Volume
Simplified:
Relative Volume = Current Volume ÷ Average Volume
Example:
Current volume:
$10 billion
Average:
$5 billion
Relative volume:
2.0
or:
200% of average.
4. Breakout Volume
Compare breakout volume with:
- prior sessions
- average volume
- previous breakout attempts
5. Spot vs Derivatives Volume
A crypto trader may compare:
Spot Volume
against:
Perpetual/Futures Volume.
A move dominated almost entirely by leveraged derivatives may have different characteristics from one supported by broad spot demand.
6. Open Interest
Volume measures trading activity.
Open interest measures outstanding derivatives positions.
They are different.
High Volume + Rising Open Interest
Can indicate new derivative positions entering.
High Volume + Falling Open Interest
Can indicate positions being closed or liquidated.
This can materially change interpretation.
7. Volume Profile
Measure activity by price.
Useful metrics include:
- Point of Control
- Value Area
- High-Volume Nodes
- Low-Volume Nodes
8. DEX Volume
For DeFi assets, decentralized exchange volume can help evaluate genuine on-chain market activity.
9. Buy/Sell Aggression
More advanced platforms may analyze:
- market buys
- market sells
- bid/ask execution
This can provide more detail than total volume.
10. Volume Trend
Ask:
Is volume:
- expanding?
- contracting?
- stable?
over several periods.
One isolated bar provides less information than a developing trend.
8. Real-World Use Cases
Use Case 1 — Breakout Confirmation
Resistance:
$100
Price closes:
$105
Recent average volume:
1 million units
Breakout volume:
2.2 million units
The move occurred with:
220% of average volume.
This can strengthen the breakout thesis.
Use Case 2 — Low-Volume Breakout
Resistance:
$100
Price reaches:
$103
but volume is:
50% below average.
A trader may wait for additional confirmation instead of immediately chasing the breakout.
Use Case 3 — Healthy Pullback
Bitcoin rallies strongly.
Rally volume:
high.
Then price retraces.
Pullback volume:
steadily declines.
Possible interpretation:
selling pressure during the pullback is relatively weak.
If buyers later re-enter on expanding volume, continuation becomes more plausible.
Use Case 4 — Capitulation
A token has declined for months.
Suddenly:
- price drops sharply
- volume reaches an extreme
- long lower wick forms
- price recovers strongly
This may indicate:
panic selling absorbed by buyers.
But additional confirmation remains necessary.
Use Case 5 — Resistance Rejection
Ethereum reaches major resistance.
A large bearish candle appears with unusually high volume.
This indicates substantial participation behind the rejection.
Combined with:
- bearish RSI divergence
- weakening MACD
the technical picture becomes more meaningful.
Use Case 6 — Volume Divergence
Price makes:
higher highs
while volume consistently declines.
This can indicate fewer participants are supporting the advance.
It is a warning—not an automatic short signal.
Use Case 7 — Volume Profile Support
Suppose Volume Profile identifies heavy historical trading around:
$90,000–$92,000.
Traditional price analysis also identifies this as support.
The overlap can create:
confluence.
9. Risks & Challenges
Volume is extremely useful but frequently misinterpreted.
1. High Volume Is Not Automatically Bullish
A large bearish candle on high volume may indicate strong selling.
Always analyze price direction and candle structure.
2. Low Volume Is Not Automatically Bearish
A low-volume pullback inside a strong uptrend can actually support a continuation thesis.
3. Exchange Fragmentation
One exchange’s volume may not represent the entire market.
4. Spot and Futures Confusion
Large derivatives volume may reflect:
- speculation
- hedging
- leverage
rather than direct underlying demand.
5. Volume Spikes After News
Major announcements can create extreme volume.
This does not automatically establish a sustainable trend.
6. Wash Trading
Poor-quality exchange data can distort analysis.
7. Volume Without Context
A large volume bar in the middle of a random range may be difficult to interpret.
Location matters.
8. False Breakouts Still Occur on High Volume
No confirmation method is perfect.
A high-volume breakout can reverse.
9. Different Asset Characteristics
Normal volume for Bitcoin is completely different from normal volume for a small-cap token.
Use relative comparisons.
10. Low-Liquidity Tokens
A small-cap token may appear to have rising volume but still be extremely difficult to exit at scale.
11. Indicator Overload
Volume should not become another reason to add endless chart indicators.
Start with raw volume and market structure.
12. Leverage
Strong volume confirmation does not eliminate trade risk.
Position sizing remains necessary.
10. Future Outlook: 3–5 Years
Volume analysis will become considerably richer as trading data becomes more accessible.
Unified Crypto Volume
Future platforms may aggregate:
- centralized exchange spot volume
- futures volume
- perpetual volume
- DEX volume
into more comprehensive market views.
Real-Time Order Flow
Advanced order-flow tools may become increasingly accessible to retail traders.
These can show:
- aggressive buying
- aggressive selling
- liquidity clusters
- executed volume
AI-Assisted Interpretation
Rather than displaying:
Volume +120%
AI systems may explain:
“Bitcoin broke weekly resistance with spot volume approximately twice its recent average while futures open interest increased moderately, suggesting participation expanded without an extreme leverage build-up.”
This is much more useful than raw data.
On-Chain Volume Integration
Blockchain analysis can combine chart volume with:
- exchange inflows
- stablecoin activity
- wallet transfers
- DEX transactions
This can produce crypto-specific market intelligence.
Better Manipulation Detection
Analytics systems may increasingly identify:
- wash trading
- suspicious volume
- unusual liquidity patterns
improving data quality.
Institutional-Grade Tools for Retail Traders
Metrics historically used by professional traders may become easier to access, including:
- VWAP
- execution flow
- liquidity maps
- volume profile
- market depth
11. Investment & Trading Implications
A beginner should incorporate volume systematically.
Step 1 — Identify Market Structure
Before looking at volume, determine:
Uptrend
Downtrend
or:
Range.
Step 2 — Identify Support and Resistance
Know where price is interacting with important zones.
Step 3 — Observe Normal Volume
Before identifying a spike, understand what ordinary activity looks like.
Step 4 — Compare Current Volume
Ask:
Above average?
Below average?
Increasing?
Declining?
Step 5 — Compare Volume with Price
Use the basic matrix:
Price Up + Volume Up
Potentially stronger bullish participation.
Price Up + Volume Down
Potentially weakening participation.
Price Down + Volume Up
Potentially stronger selling pressure.
Price Down + Volume Down
Potentially weakening selling pressure.
Treat these as clues, not rules.
Step 6 — Evaluate Breakouts
When price breaks support or resistance, ask:
- Did volume expand?
- Did the candle close beyond the level?
- Was there follow-through?
Step 7 — Evaluate Pullbacks
During an uptrend, declining volume on a correction can be constructive.
During a downtrend, declining volume on a rebound may indicate weak buying.
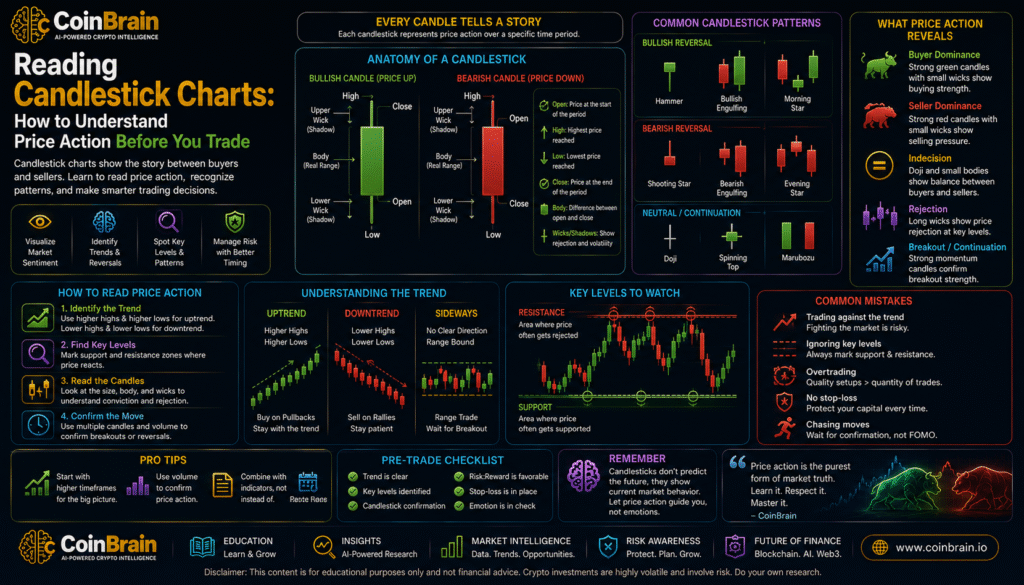
Step 8 — Combine with Candlesticks
A large lower wick at support means more when accompanied by unusual volume.
Step 9 — Add RSI and MACD Carefully
Suppose:
- support holds
- volume expands on the rebound
- RSI momentum improves
- MACD histogram contracts negatively
Multiple pieces of evidence support the same thesis.
Step 10 — Check Spot vs Derivatives
For major crypto moves, ask whether activity is primarily:
spot-driven
or:
leveraged derivatives-driven.
This can provide useful context.
Step 11 — Define Invalidation
Volume confirms or challenges a setup.
It does not determine stop placement by itself.
Use price structure.
Step 12 — Manage Position Size
No amount of volume confirmation eliminates uncertainty.
A Beginner Example
Suppose Bitcoin trades below:
$100,000 resistance.
It has failed at this level three times.
Then:
Price
Bitcoin moves from:
$98,000 → $103,000
and closes above resistance.
Candlestick
Large bullish body.
Close near the high.
Volume
Recent daily average:
$25 billion
Breakout-day volume:
$45 billion
RSI
RSI rises:
58 → 67
MACD
Positive histogram begins expanding.
A beginner might say:
“Bitcoin broke $100,000.”
A more disciplined interpretation is:
Resistance Break
Strong Candle Close
Volume Expansion
Positive Momentum
This creates a stronger breakout case.
But the trader still defines:
- invalidation
- position size
- risk-to-reward
because even strong breakouts can fail.
Example: Weak Breakout
Same resistance:
$100,000
Bitcoin trades briefly at:
$101,500
but:
- closes at $100,300
- volume is below average
- RSI remains flat
- MACD histogram contracts
The breakout is less convincing.
A trader may decide:
wait for confirmation.
Doing nothing is a valid trading decision.
Example: Capitulation at Support
Ethereum falls sharply toward:
$3,000 support.
The daily candle:
- trades to $2,850
- closes at $3,150
- produces the highest volume in months
RSI:
24
MACD:
still negative.
Interpretation:
Heavy selling occurred, but buyers absorbed substantial supply and pushed price back above support.
This can justify monitoring for a reversal.
It does not guarantee one.
The CoinBrain Volume Checklist
Before using volume in a trading decision, ask:
Price
- What is price actually doing?
Structure
- Is price at support, resistance or breakout?
Relative Volume
- Is volume above or below recent average?
Direction
- Is volume expanding during rises or declines?
Candle
- What does the candle structure show?
Breakout
- Did volume expand with the breakout?
Pullback
- Is corrective volume weakening?
Spot vs Futures
- Where is the activity occurring?
Open Interest
- Are derivative positions expanding or being closed?
Timeframe
- Is the volume significant on a meaningful timeframe?
Confirmation
- Do RSI, MACD or market structure agree?
Risk
- What happens if the interpretation is wrong?
If the analysis is simply:
“Volume is high, therefore buy.”
more context is required.
Business Implications
Volume analytics represent an important opportunity for modern trading platforms.
A sophisticated system could combine:
- spot volume
- futures volume
- open interest
- DEX volume
- volume profile
- order-book liquidity
and translate them into understandable explanations.
Instead of:
“Volume: $45B”
a trading assistant might say:
“Bitcoin’s breakout occurred on volume approximately 70% above its recent daily average. Spot participation increased alongside derivatives activity, while open interest rose moderately rather than explosively.”
This transforms raw data into:
market context.
For newcomers, this type of educational interpretation could be far more useful than simple buy/sell signals.
12. Final Analysis
Volume adds an important dimension to technical analysis.
Candlesticks show:
how price moved.
Support and resistance show:
where price moved.
RSI shows:
how strong recent momentum is.
MACD shows:
how trend and momentum are evolving.
Fibonacci helps identify:
potential pullback zones.
Volume now adds:
how much market participation supports those movements.
This gives us an increasingly complete technical framework:
Price Action
Market Structure
Momentum
Potential Levels
Participation
Volume is especially useful when evaluating:
breakouts.
A breakout without meaningful participation may deserve caution.
A breakout supported by:
- strong candle structure
- increasing volume
- improving momentum
provides a more complete thesis.
But volume must never be interpreted mechanically.
High volume does not mean buy.
Low volume does not mean sell.
The correct question is:
What is market participation telling me about the price move currently taking place?
That requires context.
The strongest traders do not search for one indicator that predicts the future.
They combine several independent pieces of evidence and then manage the risk that the interpretation may still be wrong.
The central CoinBrain principle is therefore:
Price tells you what happened. Volume helps tell you how seriously the market participated in making it happen.
That makes volume one of the most valuable confirmation tools in technical analysis.
13. References & Further Reading
CMT Association
Volume and Technical Analysis
Professional technical-analysis resources covering volume confirmation, market participation, price trends and volume-based tools.
CME Group
Volume, Open Interest and Market Activity
Educational material explaining the distinction between trading volume, open interest and derivatives-market participation.
Fidelity
Using Volume in Technical Analysis
Educational resources covering volume trends, breakout confirmation and price-volume relationships.
Charles Schwab
Volume and Price Analysis
Educational material discussing how traders use volume to evaluate trend strength and market participation.
TradingView
Volume, Volume Profile, OBV and VWAP
Charting documentation for volume indicators and price-by-volume analysis.
Concepts for Further Study
Readers progressing beyond the fundamentals should investigate:
- trading volume
- relative volume
- average daily volume
- volume confirmation
- breakout volume
- capitulation volume
- volume divergence
- Volume Profile
- Point of Control
- High-Volume Nodes
- Low-Volume Nodes
- On-Balance Volume
- VWAP
- market depth
- liquidity
- slippage
- spot volume
- futures volume
- open interest
- order flow
CoinBrain Learn Trading
Article 01 — Reading Candlestick Charts: How to Understand Price Action Before You Trade
Article 02 — Support and Resistance: How Traders Identify Important Price Levels
Article 03 — What Is RSI? Understanding Momentum, Overbought and Oversold Markets
Article 04 — What Is MACD? How Traders Read Momentum and Trend Changes
Article 05 — Fibonacci Retracement: How Traders Identify Potential Pullback and Target Zones
Article 06 — Volume Analysis: How Trading Activity Can Confirm—or Question—Price Moves
Next Article
Article 07 — Trading Risk Management: Position Sizing, Stop-Losses and Protecting Your Capital
CoinBrain Research Articles
Research. Understand. Decide.

Leave a Reply
You must be logged in to post a comment.