

Fibonacci Retracement: How Traders Identify Potential Pullback and Target Zones
CoinBrain Research Articles | Learn Trading — Article 05
Updated: August 2026
Markets rarely move in a straight line.
An asset can rise strongly, then pull back.
It can fall sharply, then recover temporarily.
These temporary moves against the broader trend are often called:
Retracements
or:
Pullbacks
One of the most widely used tools for estimating where these pullbacks may pause is:
Fibonacci Retracement
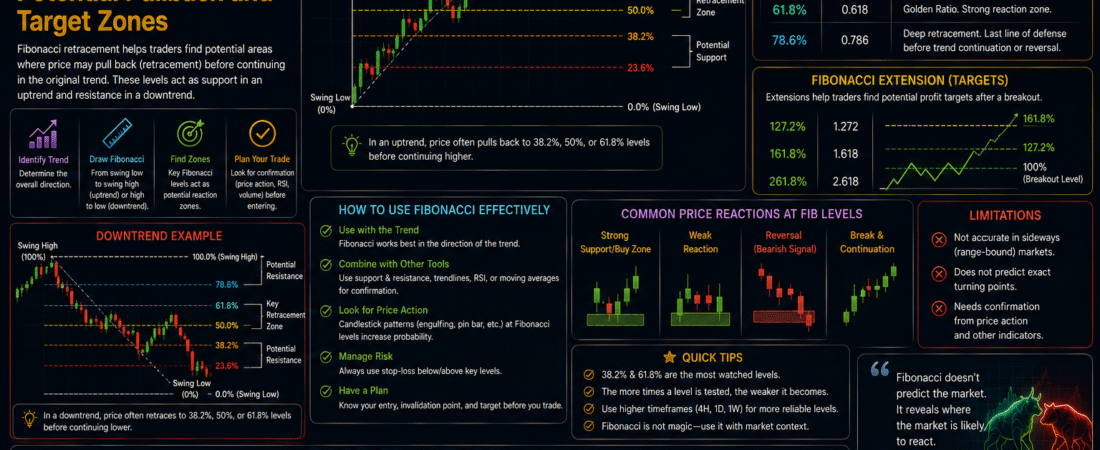
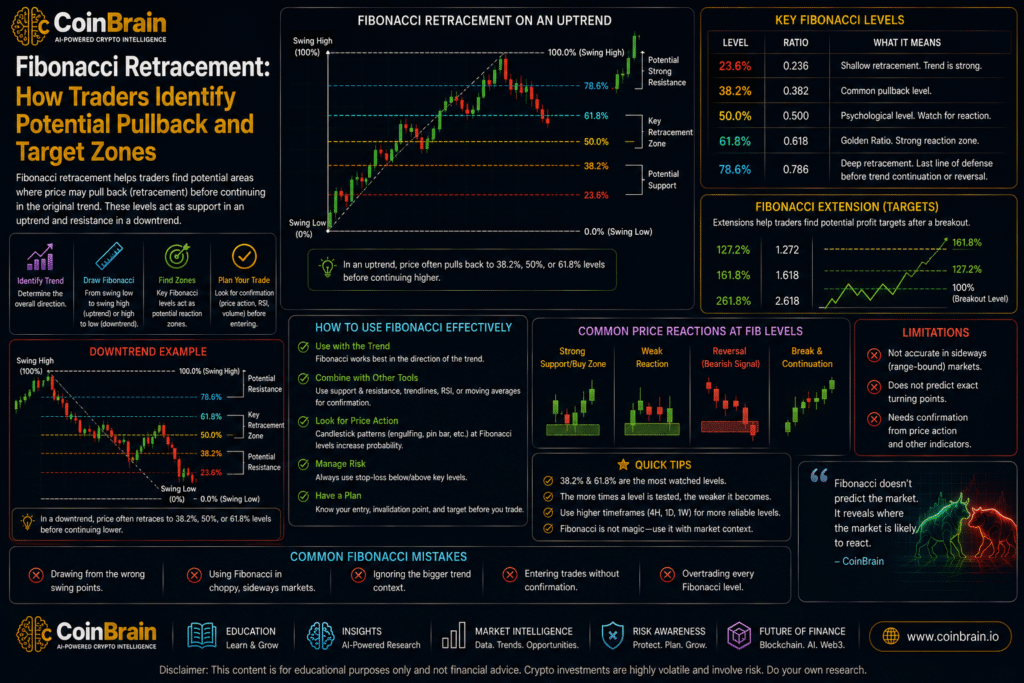
Fibonacci retracement uses percentage levels derived from the Fibonacci sequence to divide a previous price move into potential reaction zones.
Common levels include:
23.6%
38.2%
50%
61.8%
78.6%
Traders use these levels to ask questions such as:
- Where might a pullback find support?
- Where could a recovery encounter resistance?
- Is the current correction shallow or deep?
- Does a Fibonacci level align with previous support or resistance?
- Where could a trader define risk or potential targets?
But Fibonacci retracement is frequently misunderstood.
A Fibonacci level is not a hidden law of the market.
Price does not reverse at 61.8% simply because a mathematical ratio exists.
The tool becomes useful when Fibonacci levels overlap with other evidence:
Trend + Support & Resistance + Candlesticks + Volume + Momentum + Market Structure
That overlap is often called:
confluence.
The most important principle is therefore:
Do not trade a Fibonacci number simply because price touched it. Use Fibonacci to identify areas where multiple pieces of market evidence may come together.
Educational Notice: This article is for educational and research purposes only. It does not constitute financial or investment advice. Fibonacci retracement is a technical-analysis tool and does not reliably predict future price movements. Cryptocurrency trading can result in substantial losses, particularly when leverage is used.
1. Executive Summary
Fibonacci retracement is a technical-analysis method used to estimate potential support or resistance levels during a pullback within a larger price move.
The tool begins by identifying a meaningful:
Swing Low
and:
Swing High
Then the distance between these prices is divided using common Fibonacci-related percentages.
For example, suppose Bitcoin rises from:
$80,000
to:
$100,000
The total move is:
$20,000
A 50% retracement would be approximately:
$90,000
A 61.8% retracement would be approximately:
$87,640
These become potential areas traders may watch during a correction.
The most commonly monitored retracement levels are:
23.6%
38.2%
50%
61.8%
78.6%
The:
50%
level is not technically a Fibonacci ratio, but it is widely included because markets often retrace approximately half of a prior move.
Fibonacci tools can also include:
extensions
such as:
127.2%
161.8%
which traders sometimes use to estimate potential price targets beyond the previous high or low.
However, Fibonacci should be interpreted as:
a framework for potential reaction zones
rather than:
a prediction system.
2. Key Takeaways
1. Fibonacci retracement measures pullbacks within a prior price move
It helps traders identify potential areas where a correction may pause.
2. Common retracement levels include 23.6%, 38.2%, 50%, 61.8% and 78.6%
These are not guaranteed reversal points.
3. The 61.8% ratio is known as the Golden Ratio
It is derived from relationships within the Fibonacci sequence.
4. The 50% level is widely used even though it is not a Fibonacci ratio
It has long been observed as a psychologically important retracement area.
5. Fibonacci works best when anchored to meaningful swing highs and lows
Poor anchor selection produces poor analysis.
6. Trend direction matters
In an uptrend, retracement levels can identify potential support.
In a downtrend, they can identify potential resistance.
7. Confluence improves usefulness
A Fibonacci level aligned with:
- previous support
- resistance
- trend line
- moving average
- candlestick reaction
can be more meaningful.
8. Deep retracements imply weaker trend structure than shallow pullbacks
But they do not automatically indicate trend failure.
9. Fibonacci extensions can help estimate potential targets
Common extensions include 127.2% and 161.8%.
10. Different traders may choose different swing points
This introduces subjectivity.
11. Fibonacci should not be used alone
It is best treated as one layer within technical analysis.
12. Risk management remains essential
A Fibonacci level can fail completely.
3. Market Overview
What Is a Retracement?
Suppose Ethereum rises:
$3,000 → $4,000
Then temporarily falls to:
$3,600
before continuing higher.
The decline from:
$4,000 → $3,600
is a:
retracement.
It moves against the broader upward trend but does not necessarily reverse it.
Retracement vs Reversal
These concepts should not be confused.
Retracement
Temporary movement against the broader trend.
Reversal
The broader trend itself changes direction.
For example:
Uptrend
↓
Pullback
↓
Higher Low
↓
Uptrend Continues
This is a retracement.
But:
Uptrend
↓
Price Breaks Major Support
↓
Lower High
↓
Lower Low
may indicate a trend reversal.
Fibonacci cannot determine this alone.
Market structure remains essential.
Why Pullbacks Occur
Markets rarely move continuously in one direction because participants:
- take profits
- enter new positions
- rebalance
- hedge
- react to news
- adjust leverage
After a strong rally, some buyers sell.
Price falls.
Other participants who missed the original move may wait for lower prices.
This creates a pullback.
Shallow vs Deep Retracement
A strong trend may produce only a shallow pullback.
Example:
23.6%
or:
38.2%.
A more substantial correction may reach:
50%
or:
61.8%.
A very deep retracement may approach:
78.6%.
But there is no universal rule that says:
shallow = bullish
and:
deep = bearish.
Context matters.
4. Technical Deep Dive
Where Fibonacci Ratios Come From
The Fibonacci sequence begins:
0, 1, 1, 2, 3, 5, 8, 13, 21, 34, 55, 89…
Each number is approximately the sum of the previous two.
As the sequence progresses, dividing one number by the next approaches:
0.618
or:
61.8%.
This is often called the:
Golden Ratio.
Other ratios used by traders can be derived mathematically from relationships within the sequence.
Common Fibonacci Levels
The standard retracement levels are:
23.6%
Very shallow pullback.
38.2%
Commonly watched in strong trends.
50%
Half of the prior move.
61.8%
The Golden Ratio and one of the most closely watched levels.
78.6%
A deep retracement.
Drawing Fibonacci in an Uptrend
Suppose Bitcoin moves from:
Swing Low = $80,000
to:
Swing High = $100,000
Total move:
$20,000
To analyze a pullback, draw Fibonacci from:
Low → High
Potential levels become:
23.6%
$100,000 − ($20,000 × 0.236)
≈ $95,280
38.2%
≈ $92,360
50%
≈ $90,000
61.8%
≈ $87,640
78.6%
≈ $84,280
These become areas to monitor.
Drawing Fibonacci in a Downtrend
Suppose an asset falls:
$100 → $60
Then begins recovering.
The trader can draw:
High → Low
Potential retracement levels above the low may identify areas where sellers could return.
For example, a 50% recovery of a $40 decline would occur near:
$80.
Choosing Swing Points
This is one of the most important practical issues.
Fibonacci should generally be anchored to:
meaningful market swings.
For example:
- major daily low to major daily high
- breakout swing low to subsequent high
- significant high to major low
Avoid choosing tiny arbitrary movements simply because they create attractive levels.
The 50% Retracement
The 50% level deserves special explanation.
It is not derived directly from the Fibonacci sequence.
Yet traders commonly include it.
Why?
Markets often experience:
half retracements
because 50% represents a natural midpoint of the prior move.
It also has a long history in traditional technical analysis.
Golden Pocket
Some traders refer to the area around:
61.8%–65%
as the:
Golden Pocket.
This region is commonly watched during pullbacks.
But it should not be treated as a guaranteed high-probability reversal zone.
Fibonacci Extensions
Retracements analyze pullbacks within an existing move.
Extensions attempt to estimate potential targets beyond the previous extreme.
Common extension levels include:
127.2%
161.8%
200%
261.8%
For example:
Swing:
$80 → $100
If price breaks above $100 after a correction, traders might use a 161.8% extension to estimate a potential continuation target.
Again:
Target ≠ Prediction
It is simply a reference level.
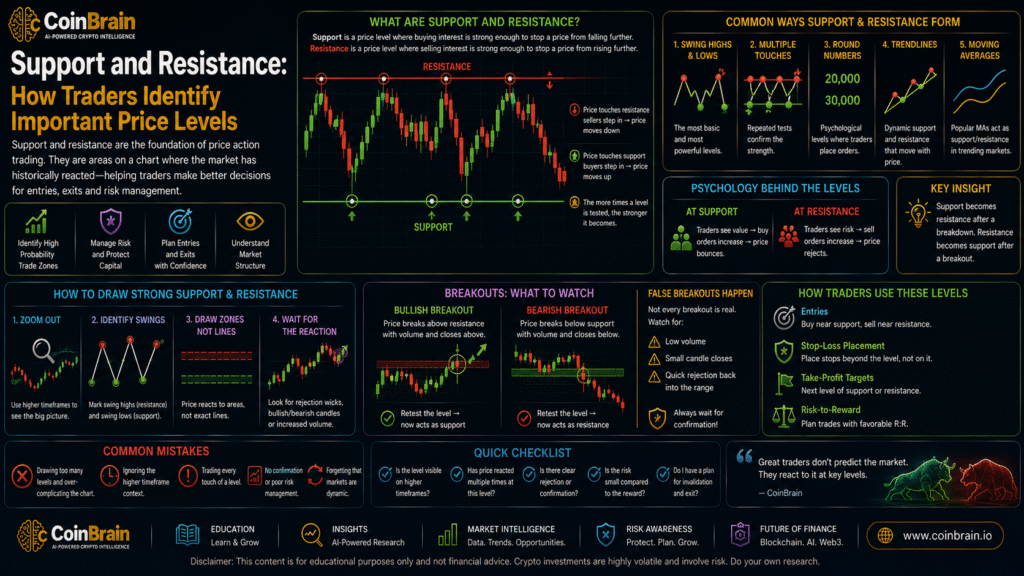
Fibonacci Confluence
The strongest use of Fibonacci often occurs when several analytical tools point toward the same region.
Suppose:
61.8% retracement = $90,500
and:
previous resistance turned support = $90,000–$91,000
and:
daily moving average = $90,800
This creates:
Confluence Zone
A trader may monitor that area more closely.
5. Current Industry Landscape
Fibonacci tools are widely available across modern charting platforms.
They are used by traders in:
- crypto
- equities
- forex
- commodities
- futures
Common tools include:
- Fibonacci retracement
- Fibonacci extension
- Fibonacci projection
- Fibonacci time zones
Retracement and extension remain the most common.
Crypto Trading
Crypto traders frequently use Fibonacci because:
- price trends can be large
- volatility is high
- pullbacks can be substantial
Popular timeframes include:
- 1-hour
- 4-hour
- daily
- weekly
Algorithmic Markets
Markets today are dominated partly by automated systems.
This raises an important point:
Fibonacci levels do not work because algorithms necessarily obey ancient mathematical ratios.
Instead, widely watched levels can become part of:
market expectations and order placement.
If enough participants monitor similar areas, those areas may attract liquidity.
Charting Platforms
Modern platforms allow traders to:
- automatically calculate retracement levels
- customize ratios
- extend lines
- save templates
- combine Fibonacci with other indicators
This makes the tool easy to use.
The hard part is still:
selecting meaningful swing points and interpreting context.
6. Institutional Activity
Institutional traders may use Fibonacci levels, but they generally do not rely on them as primary decision tools.
Professional analysis tends to focus more heavily on:
- liquidity
- volume
- order flow
- volatility
- market structure
- execution levels
Fibonacci may serve as an additional technical reference.
Institutional Confluence
Suppose a retracement level overlaps with:
- previous weekly support
- high-volume price area
- institutional execution benchmark
The overlapping evidence may make the region more relevant.
Profit-Taking Zones
Professional traders often plan exits around market structure.
Fibonacci extensions can provide an additional framework for:
- scaling out
- evaluating trend continuation
But targets must still consider:
- liquidity
- resistance
- volatility
Algorithmic Execution
Institutions frequently break large orders into smaller executions.
Price retracements into liquid areas can provide better execution opportunities than chasing strong price expansion.
This creates a broader institutional principle that aligns with Fibonacci usage:
Buying pullbacks can provide better risk/reward than chasing extended moves—when the larger thesis remains valid.
7. Market Data & Metrics
Fibonacci analysis can be strengthened with several measurements.
1. Swing Range
Formula:
Swing Range = High − Low
Example:
High:
$100
Low:
$60
Range:
$40
All retracement levels derive from this range.
2. Retracement Percentage
Suppose price rises:
$60 → $100
then falls to:
$80.
Retracement:
$20
relative to:
$40 swing
Therefore:
50% retracement.
3. Candle Reaction
At the Fibonacci level, check:
- wick rejection
- engulfing candles
- strong close
4. Volume
Does trading activity increase when price reaches the area?
5. Support/Resistance Alignment
Does Fibonacci overlap with previously identified levels?
6. Trend Strength
Is the broader market making:
higher highs and higher lows
or:
lower highs and lower lows?
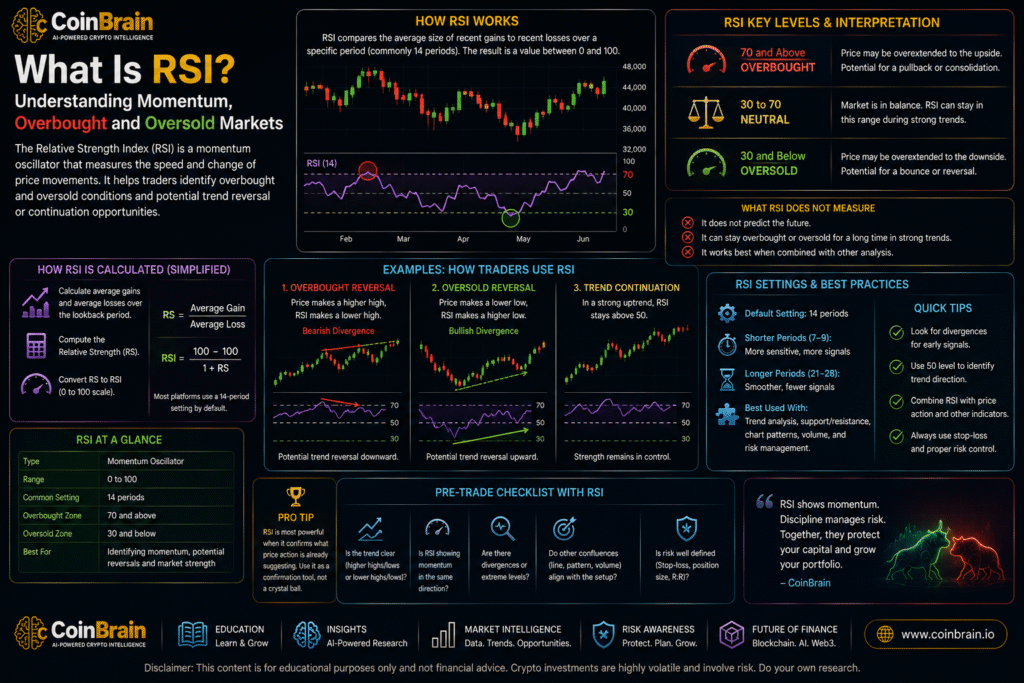
7. RSI
A pullback toward Fibonacci support combined with RSI resetting from overbought conditions can provide additional context.
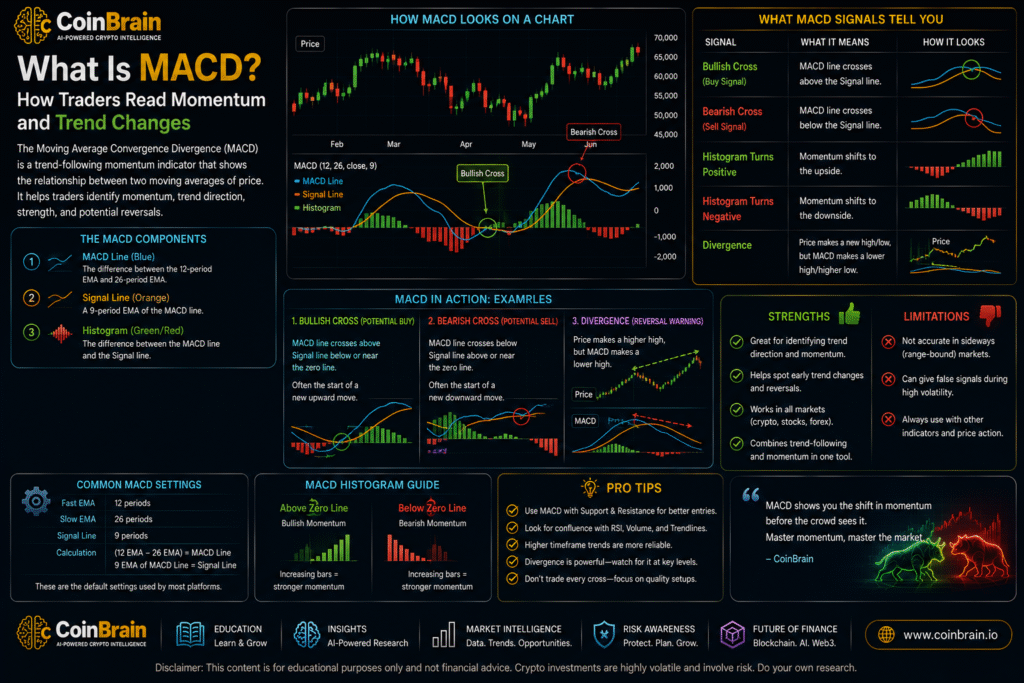
8. MACD
MACD can help determine whether momentum is:
- stabilizing
- weakening
- recovering
near a retracement level.
9. Number of Confluences
A useful qualitative framework:
One Signal
Fibonacci only.
Two Signals
Fibonacci + support.
Three Signals
Fibonacci + support + bullish candlestick.
Four Signals
Fibonacci + support + candle + increasing volume.
More signals do not guarantee success.
But the setup becomes more context-rich.
8. Real-World Use Cases
Use Case 1 — Buying a Pullback in an Uptrend
Bitcoin rallies:
$80,000 → $100,000
Then corrects.
Important levels:
38.2% = ~$92,360
50% = $90,000
61.8% = ~$87,640
Suppose previous resistance exists around:
$90,000–$91,000.
The 50% retracement overlaps the old resistance.
This creates a potential support area.
Use Case 2 — Selling a Recovery in a Downtrend
A token falls:
$100 → $60
Then rebounds.
A 61.8% retracement of the decline sits around:
$84.72
If previous support near:
$85
has now become resistance, the zone may attract sellers.
Use Case 3 — Combining Fibonacci with Candlesticks
Price reaches:
61.8% retracement
and forms:
- long lower wick
- bullish close
This provides more evidence than simply touching the level.
Use Case 4 — Fibonacci and RSI
Price pulls back to:
50% retracement
while RSI falls from:
78 → 45
The market has reset momentum without becoming structurally oversold.
This may indicate a healthy pullback within an uptrend.
Use Case 5 — Fibonacci and MACD
A correction reaches:
61.8%
while:
- negative MACD histogram bars shrink
- MACD begins turning upward
Momentum deterioration may be slowing.
Use Case 6 — Breakout Target
Price breaks above:
$100 resistance
after retracing successfully.
A trader might use:
127.2%
or:
161.8% extension
as potential target references.
Use Case 7 — Stop Placement
A trader should not place a stop simply:
one dollar below Fibonacci.
Instead, stop placement should relate to:
- market structure
- support
- volatility
- invalidation
The Fibonacci level itself is not an invalidation rule.
9. Risks & Challenges
Fibonacci analysis has important limitations.
1. Subjective Anchor Points
Two traders can choose different swing highs and lows and generate different levels.
This is one of Fibonacci’s biggest weaknesses.
2. Too Many Fibonacci Levels
If enough ratios are drawn, price will eventually appear to react to one.
This can create false confidence.
3. Retrospective Pattern Matching
After the move happens, it is easy to say:
“Price reversed exactly at the 61.8% level.”
Live trading is much less clean.
4. Treating Ratios as Natural Laws
There is no guarantee that financial markets must respect Fibonacci ratios.
The levels are analytical references—not physical laws.
5. Ignoring Trend
Buying a 61.8% retracement inside a collapsing market can be dangerous.
6. Ignoring Market Structure
If price breaks major support, the previous Fibonacci framework may no longer be relevant.
7. Ignoring Volume
A level without meaningful participation may fail easily.
8. Using Fibonacci Alone
A Fibonacci touch is not enough.
Seek confirmation.
9. False Precision
Traders sometimes calculate:
61.8% = $87,642.17
and assume price must react exactly there.
That level should usually be treated as a:
zone
rather than an exact number.
10. Deep Retracement Confusion
A 78.6% retracement can still technically remain within the prior swing.
But the trend may already be structurally weak.
Use price structure.
11. Overtrading
If every swing receives a Fibonacci tool, traders may create signals everywhere.
12. Leverage
Even a good pullback level can be temporarily breached.
Excessive leverage can liquidate a position before price recovers.
10. Future Outlook: 3–5 Years
Fibonacci analysis itself is unlikely to change dramatically.
The way traders use it will.
Automated Swing Detection
AI and charting systems may automatically identify meaningful swing highs and lows.
This can reduce subjectivity.
Confluence Scoring
Future systems may say:
“The 61.8% retracement overlaps daily support, the 200-period moving average and a high-volume node.”
This is much more useful than simply displaying:
61.8%.
Probability-Based Tools
Instead of implying certainty, platforms may estimate how similar historical setups behaved.
AI-Assisted Technical Analysis
AI could combine:
- Fibonacci
- candlesticks
- RSI
- MACD
- support
- volume
and explain the complete setup.
Better Risk Visualization
Platforms may automatically show:
Potential Entry
Invalidation
Target
Risk-to-Reward
around Fibonacci zones.
This would help traders focus less on magical ratios and more on decision structure.
11. Investment & Trading Implications
A disciplined Fibonacci process can follow several steps.
Step 1 — Determine Trend
Ask:
Uptrend?
Downtrend?
Range?
Fibonacci works best when there is a meaningful directional swing to measure.
Step 2 — Identify Significant Swing
In an uptrend:
Swing Low → Swing High
In a downtrend:
Swing High → Swing Low
Step 3 — Draw the Retracement
Use the standard levels:
23.6
38.2
50
61.8
78.6
Step 4 — Compare with Support and Resistance
Which Fibonacci levels overlap existing market structure?
These deserve more attention.
Step 5 — Wait for Price
Do not assume price must reach:
61.8%.
Strong trends may reverse from 38.2%.
Others may retrace deeper.
Let the market show you.
Step 6 — Read Candlesticks
If price reaches a level, ask:
- Was it rejected?
- Did buyers enter?
- Did sellers enter?
Step 7 — Check RSI
Is momentum:
- resetting?
- oversold?
- diverging?
Step 8 — Check MACD
Is trend momentum:
- strengthening?
- weakening?
- turning?
Step 9 — Check Volume
Is the reaction supported by meaningful participation?
Step 10 — Define Invalidation
If your thesis depends on the larger uptrend remaining intact, identify the structural price level that proves you wrong.
Step 11 — Calculate Risk-to-Reward
Potential target may be:
- previous high
- next resistance
- Fibonacci extension
Compare it with potential loss.
Step 12 — Avoid Chasing
If price never returns to your planned zone:
let the trade go.
Missing a trade is not the same as losing money.
A Beginner Example
Suppose Ethereum rises:
$3,000 → $4,000
Trend:
bullish.
The move is:
$1,000.
Fibonacci levels include approximately:
38.2%
$3,618
50%
$3,500
61.8%
$3,382
Now examine market structure.
Previous resistance:
$3,450–$3,550
The:
50% Fibonacci level
sits directly inside this zone.
Price corrects to:
$3,490.
Then:
Candlestick
A four-hour candle creates a long lower wick.
RSI
RSI falls from:
75 → 44
and starts rising.
MACD
Histogram remains negative but begins contracting.
Volume
Buying volume increases during the recovery.
A beginner might say:
“50% Fibonacci worked.”
A more sophisticated trader says:
“The 50% retracement aligned with former resistance turned support, momentum reset, sellers failed to sustain lower prices and buyers demonstrated renewed participation.”
The Fibonacci level was useful.
But:
the confluence created the trade thesis.
Example: Fibonacci Failure
Bitcoin rallies:
$80,000 → $100,000
Trader plans to buy:
61.8% = ~$87,640
Price reaches:
$87,600
but:
- closes strongly below the zone
- breaks previous structural low
- volume expands on selling
The trader says:
“But 61.8% should hold.”
That is the wrong approach.
The market has provided new information.
The correct response is:
reassess the thesis.
A technical level never has authority over price.
Fibonacci + Candlesticks + Support
A useful beginner setup may look like:
Uptrend
↓
Pullback
↓
Fibonacci Level
Previous Support
↓
Bullish Candlestick
↓
Confirmation
↓
Risk Evaluation
This is much stronger than:
Price touched Fibonacci → Buy.
Fibonacci Extensions for Targets
Suppose price successfully retests the:
50% level
and then breaks above the previous high.
A trader could evaluate:
127.2% extension
or:
161.8% extension
as possible target areas.
But targets should also consider:
- previous resistance
- market volatility
- risk-to-reward
The CoinBrain Fibonacci Checklist
Before trading a Fibonacci setup, ask:
Trend
- Is there a clear directional move?
Swing
- Did I select meaningful swing points?
Level
- Which retracement is being tested?
Structure
- Does it overlap support or resistance?
Timeframe
- Is the swing meaningful on the timeframe I trade?
Candlestick
- Is price showing rejection?
RSI
- Is momentum supporting the setup?
MACD
- Is momentum stabilizing or improving?
Volume
- Are buyers or sellers participating?
Invalidation
- What price structure proves me wrong?
Target
- Previous high or extension?
Risk
- Does potential reward justify potential loss?
If the only evidence is:
“61.8% Fibonacci.”
the setup requires more work.
Business Implications
Fibonacci tools are deeply integrated into modern trading platforms.
Opportunities exist to improve them through:
- automatic swing detection
- confluence analysis
- multi-timeframe levels
- risk calculations
- AI explanations
Instead of simply drawing lines, an advanced system could explain:
“Bitcoin is approaching its 61.8% retracement from the previous daily swing. The same area overlaps former resistance and the 50-day moving average. RSI has reset toward neutral, but no bullish candlestick confirmation has appeared yet.”
This turns:
drawing tools
into:
decision-support tools.
12. Final Analysis
Fibonacci retracement gives traders a structured way to analyze one of the most common market behaviors:
the pullback.
Markets trend.
Then they correct.
The important question becomes:
Where might the correction begin to stabilize?
Fibonacci provides several candidate areas.
But the mistake is believing:
the ratio creates the reversal.
It does not.
The market decides.
The proper use of Fibonacci is therefore:
Identify Trend
↓
Measure Swing
↓
Mark Potential Retracement Zones
↓
Compare with Market Structure
↓
Wait for Price
↓
Observe Reaction
↓
Seek Confirmation
↓
Manage Risk
This continues the analytical framework developed throughout the Learn Trading series.
Article 01 — Candlesticks
How is price behaving?
Article 02 — Support & Resistance
Where is price reacting?
Article 03 — RSI
How strong is momentum?
Article 04 — MACD
How are trend and momentum evolving?
Article 05 — Fibonacci
Where might a pullback or continuation find important price zones?
The tools are becoming useful because they are being combined.
Not because one is perfect.
A strong technical setup might therefore involve:
Support Zone
50% or 61.8% Retracement
Bullish Candlestick
Improving RSI
MACD Momentum Recovery
Strong Risk-to-Reward
That still does not guarantee success.
It simply creates:
a structured probability-based trade thesis.
The central CoinBrain principle is:
Fibonacci levels are areas to investigate—not prices to trust blindly.
Use the tool to improve market context.
Never allow the tool to override the market itself.
13. References & Further Reading
CMT Association
Technical Analysis Foundations
Professional technical-analysis resources covering retracements, trends, support, resistance and price analysis.
CME Group
Fibonacci and Technical Analysis Education
Educational materials discussing retracement analysis and the use of Fibonacci relationships in chart-based market analysis.
Fidelity
Fibonacci Retracement
Investor education covering Fibonacci ratios, retracement levels and technical-analysis applications.
Charles Schwab
Technical Analysis Tools
Educational resources discussing retracement analysis, trend identification and support/resistance.
TradingView
Fibonacci Retracement
Charting documentation covering Fibonacci retracements, extensions, customizable levels and technical-analysis applications.
Concepts for Further Study
Readers progressing beyond the fundamentals should investigate:
- Fibonacci sequence
- Golden Ratio
- 23.6% retracement
- 38.2% retracement
- 50% retracement
- 61.8% retracement
- 78.6% retracement
- Golden Pocket
- Fibonacci extension
- 127.2% extension
- 161.8% extension
- swing highs
- swing lows
- pullbacks
- retracements
- reversals
- confluence
- trend continuation
- multi-timeframe analysis
- risk-to-reward
CoinBrain Learn Trading
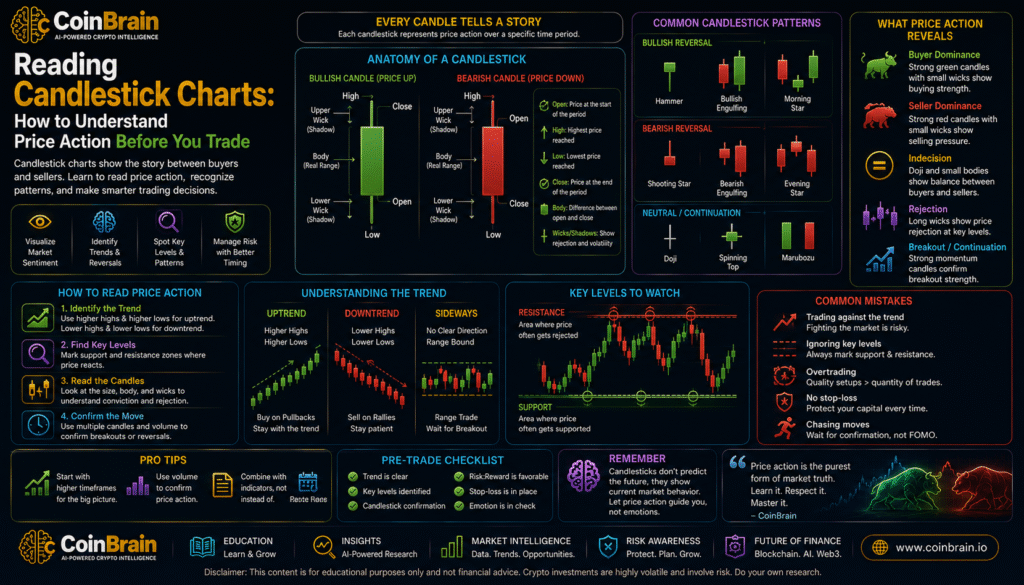
Article 01 — Reading Candlestick Charts: How to Understand Price Action Before You Trade
Article 02 — Support and Resistance: How Traders Identify Important Price Levels
Article 03 — What Is RSI? Understanding Momentum, Overbought and Oversold Markets
Article 04 — What Is MACD? How Traders Read Momentum and Trend Changes
Article 05 — Fibonacci Retracement: How Traders Identify Potential Pullback and Target Zones
Next Article
Article 06 — Volume Analysis: How Trading Activity Can Confirm—or Question—Price Moves
CoinBrain Research Articles
Research. Understand. Decide.
Leave a Reply
You must be logged in to post a comment.