

Support and Resistance: How Traders Identify Important Price Levels
CoinBrain Research Articles | Learn Trading — Article 02
Updated: August 2026
Open almost any trading chart and price can initially look chaotic.
It moves upward.
It falls.
It pauses.
It reverses.
It breaks higher.
Then sometimes it returns to exactly the same area it visited earlier.
These repeated reactions are not necessarily random.
Markets frequently develop price areas where buying or selling activity becomes particularly important.
Traders commonly describe these areas as:
Support
and:
Resistance.
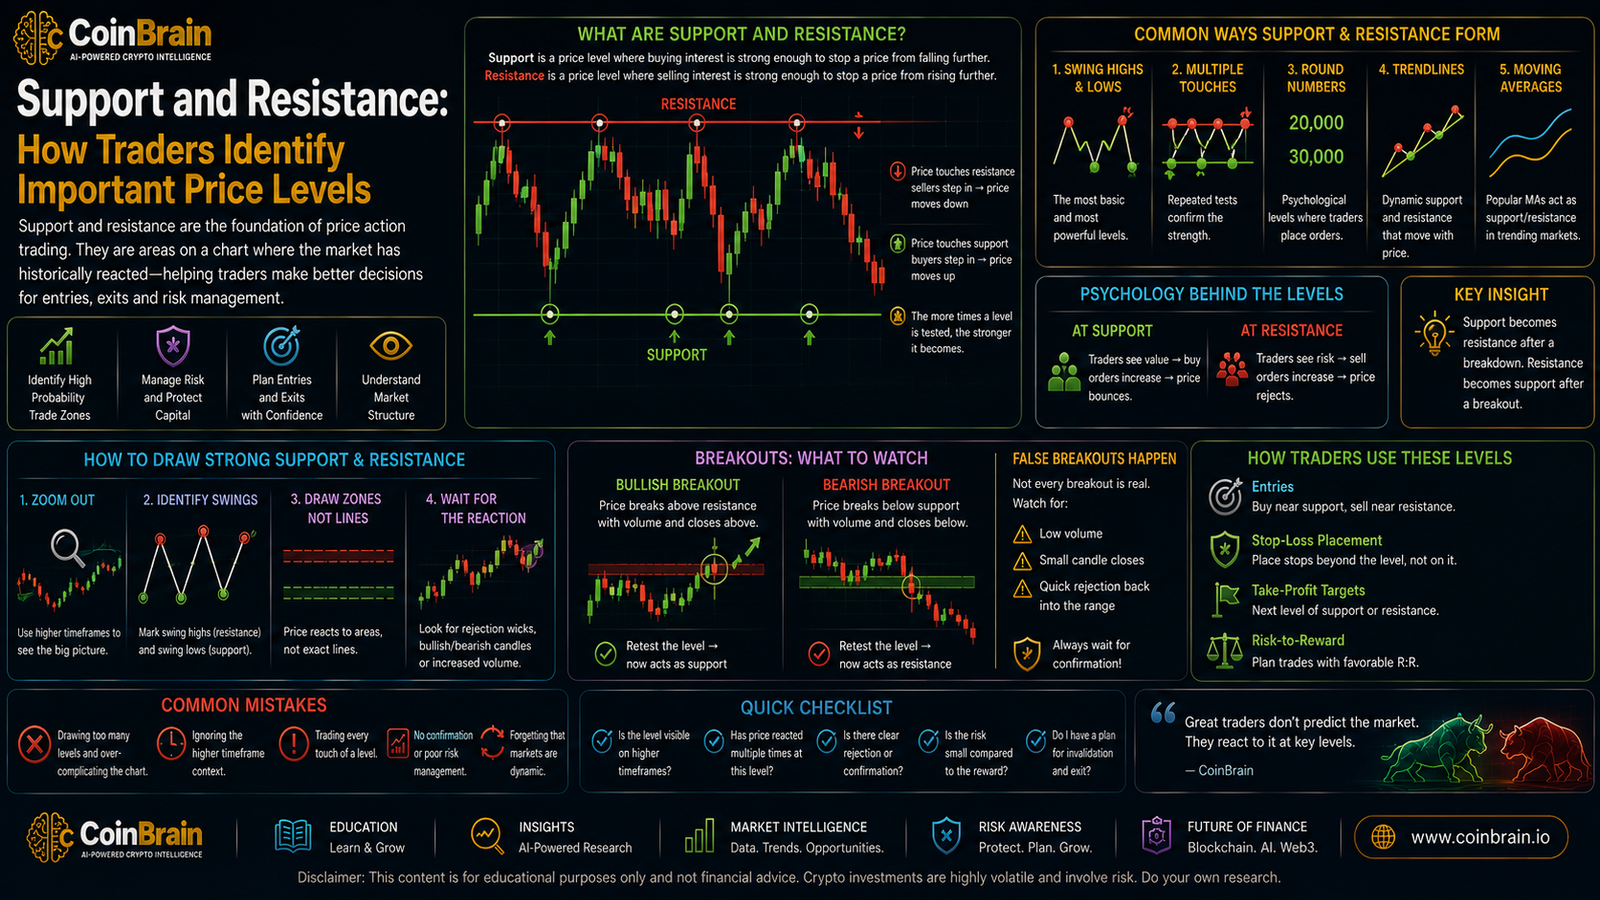
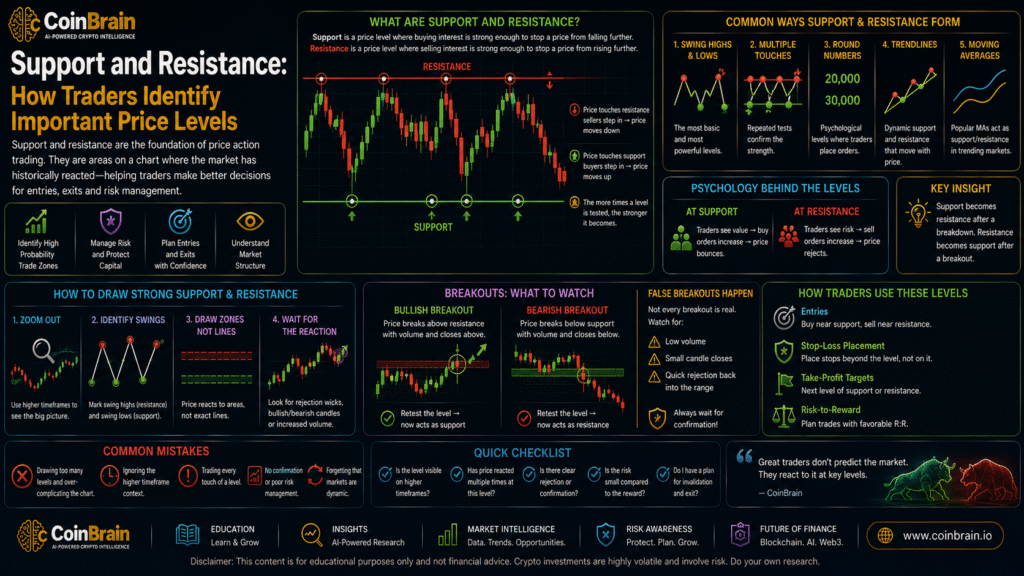
Support is an area where buying pressure has historically been strong enough to slow or reverse falling prices.
Resistance is an area where selling pressure has historically been strong enough to slow or reverse rising prices.
Understanding these areas is one of the foundations of technical analysis.
But beginners often make a critical mistake:
They imagine support and resistance as exact lines.
Markets rarely behave that precisely.
A better framework is:
Support and resistance are usually zones of market interest—not guaranteed reversal points.
Price can:
- bounce from them
- break through them
- temporarily move beyond them
- retest them
- ignore them entirely
The objective is therefore not to draw dozens of lines across a chart.
The objective is to identify where market participants have previously demonstrated meaningful buying or selling interest, then observe how price behaves when it returns.
Combined with candlestick analysis, volume, trend structure and risk management, support and resistance become powerful tools for understanding market behavior.
Educational Notice: This article is for educational and research purposes only. It does not constitute financial or investment advice. Support and resistance levels are analytical tools, not guaranteed price barriers. Cryptocurrency trading can result in substantial losses, particularly when leverage is used.
1. Executive Summary
Support and resistance describe areas where price has historically experienced meaningful buying or selling pressure.
Support
An area below current price where buyers may become more active.
Conceptually:
Price Falls
↓
Buying Interest Increases
↓
Decline Slows or Reverses
Resistance
An area above current price where sellers may become more active.
Conceptually:
Price Rises
↓
Selling Interest Increases
↓
Advance Slows or Reverses
Suppose Bitcoin repeatedly falls toward:
$90,000
and buyers repeatedly enter.
The $90,000 region may become:
support.
Suppose Bitcoin repeatedly approaches:
$100,000
but sellers repeatedly push price lower.
The $100,000 region may become:
resistance.
But these levels are not permanent walls.
Eventually:
Support can break.
And:
Resistance can break.
When this happens, an important market behavior sometimes appears:
Role Reversal.
Former resistance can become support.
Former support can become resistance.
Understanding these transitions helps traders interpret:
- trends
- breakouts
- pullbacks
- reversals
- entries
- stop placement
- profit targets
The central lesson is:
Do not ask only whether price reached support or resistance.
Ask:
How did price behave when it got there?
2. Key Takeaways
1. Support represents an area of potential buying interest
It can slow or reverse falling prices.
2. Resistance represents an area of potential selling interest
It can slow or reverse rising prices.
3. Support and resistance are usually zones
Markets rarely reverse at one perfectly precise number.
4. Repeated reactions can strengthen a level’s importance
A price area that has produced several major reactions may attract more attention.
5. Support can become resistance
After support breaks, price may return to that area and encounter sellers.
6. Resistance can become support
After a breakout, former resistance may become a buying area.
7. Higher-timeframe levels generally deserve greater attention
A weekly support zone is usually more significant than a five-minute level.
8. Round numbers can influence market behavior
Prices such as:
$50,000
$100,000
can attract attention because market participants naturally focus on psychologically significant numbers.
9. A breakout requires context
Price briefly trading above resistance does not automatically confirm a breakout.
10. Volume can strengthen breakout analysis
A breakout accompanied by significant participation can be more meaningful than one occurring on weak activity.
11. Levels eventually fail
No support or resistance area works forever.
12. Risk management remains essential
The question is not:
“Will this level definitely hold?”
It is:
“What will I do if it does not?”
3. Market Overview
Why Support and Resistance Exist
Financial markets are auctions.
Buyers want to purchase.
Sellers want to sell.
Price continuously adjusts as supply and demand interact.
At some prices, market participants may perceive an asset as attractive.
At others, they may consider it expensive.
These collective decisions can create repeated price reactions.
A Simple Example
Imagine a cryptocurrency trading at:
$50
It falls toward:
$40
Buyers enter aggressively.
Price recovers to:
$50
Later it falls again.
At approximately:
$40
buyers again become active.
The market has now demonstrated repeated demand near $40.
Traders may identify:
$40 Support Zone
Now suppose price repeatedly rises toward:
$60
but sellers appear each time.
Traders may identify:
$60 Resistance Zone
Price may then trade within:
$40–$60
This is commonly called:
a trading range.
Market Memory
Support and resistance are sometimes described using the concept of:
market memory.
Suppose many investors previously purchased Bitcoin around:
$80,000
and watched it rise to:
$100,000.
If price later returns to $80,000, some investors may view that area as attractive again.
Other investors who missed the previous opportunity may also be watching it.
This can create renewed buying interest.
Trapped Traders
Another mechanism involves traders who entered poorly.
Suppose investors buy at:
$100
Price collapses to:
$70.
Months later it recovers to:
$100.
Some holders may think:
“I can finally exit without a major loss.”
They sell.
This additional supply can contribute to resistance.
Psychological Prices
Humans naturally focus on round numbers.
Examples:
$10
$100
$1,000
$100,000
Orders can cluster around these levels.
Therefore psychological pricing can influence support and resistance.
4. Technical Deep Dive
Horizontal Support
Horizontal support is one of the simplest forms.
Suppose price repeatedly reaches approximately:
$90
and rebounds.
Instead of drawing an exact line at:
$90.00
a trader might identify a zone:
$88–$92
This accommodates normal market volatility.
Horizontal Resistance
Suppose price repeatedly struggles between:
$118–$122.
That area may become a resistance zone.
Why Zones Are Better Than Exact Lines
Consider:
First reaction:
$100.20
Second:
$99.40
Third:
$101.10
Treating:
$100.00
as an exact barrier would be unrealistic.
Markets operate through order books containing thousands or millions of orders.
Support and resistance should therefore often be interpreted as:
areas of interest.
Previous Highs
A previous significant high can become resistance.
Suppose:
Bitcoin rises to:
$105,000
then falls sharply.
Months later price returns toward $105,000.
Traders will likely watch that previous high.
Previous Lows
Previous major lows can become support.
These areas show where buyers previously gained control.
Role Reversal
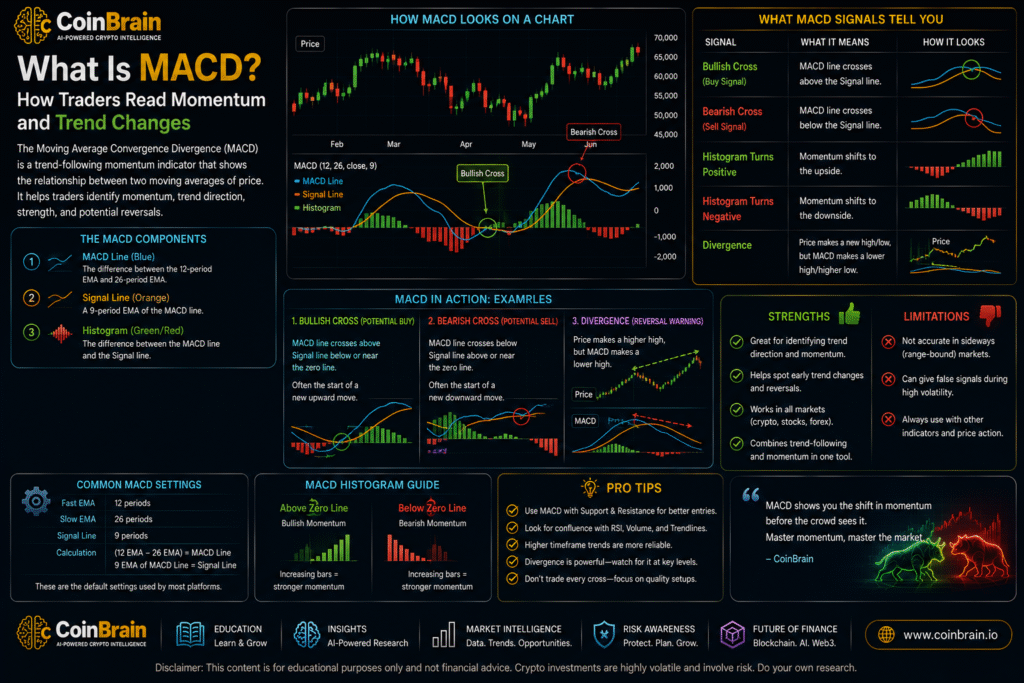
One of the most important support-and-resistance concepts is:
Role Reversal.
Resistance → Support
Suppose resistance:
$100
Price breaks above it:
$105
Later price returns toward:
$100
Buyers enter.
The previous resistance has become:
support.
Support → Resistance
Suppose support:
$80
Price breaks below:
$75
Later price recovers toward:
$80
Sellers appear.
Previous support has become:
resistance.
Why Role Reversal Can Occur
Imagine traders wanted to buy a breakout above:
$100
but missed it.
When price returns to $100, they may buy.
Meanwhile, traders who sold short near $100 may need to buy back positions if the breakout holds.
Multiple behaviors can therefore create demand near the old resistance.
Dynamic Support and Resistance
Not all important levels are horizontal.
Some traders use:
- trend lines
- moving averages
as dynamic support or resistance.
For example, price may repeatedly react around a rising moving average during an uptrend.
However:
moving averages should not be treated as magical barriers.
They are mathematical representations of historical prices.
Trend Lines
In an uptrend, traders may connect significant:
higher lows.
This creates an ascending trend line.
In a downtrend, traders may connect:
lower highs.
This creates a descending trend line.
Trend lines can act as visual guides to changing support or resistance.
Market Structure
Support and resistance become more powerful when combined with market structure.
Uptrend
Typically:
Higher Highs + Higher Lows
Downtrend
Typically:
Lower Highs + Lower Lows
Range
Price moves between relatively stable support and resistance.
Breakouts
A breakout occurs when price moves beyond an established level.
Example:
Resistance:
$100
Price moves to:
$105
But not every move above $100 is a genuine breakout.
Breakout Confirmation
Traders may examine:
Closing Price
Did the candle close beyond resistance?
Candle Structure
Was the breakout candle strong?
Volume
Did trading activity increase?
Follow-Through
Did subsequent candles continue higher?
Retest
Did former resistance hold as support?
These factors can improve breakout analysis.
False Breakouts
Suppose:
Resistance:
$100
Price briefly reaches:
$103
but closes:
$98
This is potentially a:
False Breakout
or:
Failed Breakout.
The move above resistance attracted buyers but could not sustain itself.
Liquidity Sweeps
Modern traders sometimes describe temporary moves beyond obvious highs or lows as:
liquidity sweeps.
Stop orders frequently accumulate around obvious levels.
Price moving beyond those areas can trigger:
- stop-losses
- liquidations
- breakout orders
before reversing.
This is another reason support and resistance should not be treated as exact walls.
5. Current Industry Landscape
Support and resistance remain central to technical analysis across financial markets.
They are used in:
- crypto
- equities
- forex
- commodities
- futures
But modern electronic markets have changed how these levels should be interpreted.
Algorithmic Trading
Many market participants use automated systems.
Algorithms can identify:
- previous highs
- previous lows
- volume zones
- volatility levels
- order-book liquidity
This can create rapid reactions around widely observed areas.
Crypto Derivatives
Crypto markets contain significant:
- futures
- perpetual futures
- leverage
This can intensify movements around important price levels.
A break below major support may trigger:
stop-losses
long liquidations
which can accelerate the decline.
Fragmented Liquidity
Crypto trades across multiple venues.
A resistance level on one exchange may differ slightly from another.
This reinforces the concept of:
zones rather than exact prices.
24/7 Trading
Unlike many traditional markets, crypto does not close overnight.
Support and resistance can therefore develop continuously across:
- Asian trading hours
- European trading hours
- American trading hours
- weekends
6. Institutional Activity
Professional traders use support and resistance, but usually within broader analytical frameworks.
They may combine price levels with:
- liquidity
- volume
- order flow
- volatility
- macroeconomic conditions
- derivatives positioning
Liquidity Matters
Large institutions cannot always enter or exit positions instantly.
They need liquidity.
Areas around significant highs and lows often contain substantial order activity.
Therefore professional traders may be particularly interested in:
where liquidity is concentrated.
VWAP and Institutional Benchmarks
Institutions may also monitor:
Volume Weighted Average Price — VWAP
and other execution benchmarks.
These can function as dynamic reference points.
Previous Session Levels
Professional traders frequently monitor:
- previous daily high
- previous daily low
- previous weekly high
- previous weekly low
These can become important liquidity and reaction areas.
Breakout Participation
Institutions are less interested in simply asking:
“Did price cross the line?”
They may ask:
- Was there meaningful volume?
- Did liquidity expand?
- Did price remain above the level?
- Did derivatives positioning change?
The lesson for beginners is:
confirmation matters.
7. Market Data & Metrics
Several measurements can improve support-and-resistance analysis.
1. Number of Reactions
How many times has price reacted around the area?
One reaction:
potentially weak evidence.
Multiple major reactions:
greater historical significance.
But repeated testing can also consume available orders, so more touches do not guarantee a stronger future defense.
2. Reaction Magnitude
Suppose price reaches support and rebounds:
2%.
Compare that with support producing a:
20% rally.
The second reaction indicates historically stronger significance.
3. Trading Volume
High volume around a level can indicate significant participation.
4. Timeframe
A level visible on:
weekly chart
generally deserves more attention than one visible only on:
one-minute chart.
5. Time Spent at Level
If price spends significant time trading around an area, the market may be establishing acceptance there.
6. Distance from Current Price
A level far away may have little immediate relevance.
Prioritize levels closest to current market structure.
7. Historical Highs and Lows
Major:
- all-time highs
- cycle highs
- cycle lows
often attract significant market attention.
8. Volume Profile
Volume-profile tools estimate how much trading occurred at different price levels.
This can identify:
high-volume nodes
and:
low-volume areas.
We will examine volume more deeply later in the Learn Trading series.
9. Open Interest
When derivatives open interest is high around a major level, a breakout can sometimes trigger significant position unwinding.
10. Liquidation Data
Large concentrations of leveraged positions may influence volatility around important levels.
8. Real-World Use Cases
Use Case 1 — Buying Near Support
Suppose Ethereum has repeatedly found buyers between:
$3,000–$3,100.
Price returns to:
$3,050.
A trader does not automatically buy.
Instead, the trader watches:
- candlestick reaction
- volume
- market structure
If buyers demonstrate strength, the support zone may become part of a trade setup.
Use Case 2 — Selling Near Resistance
Suppose resistance exists around:
$4,000.
Price approaches $4,000 after a large rally.
A trader may avoid opening a new long position directly below major resistance because potential upside could be limited relative to downside.
Use Case 3 — Breakout Trading
Resistance:
$50
Price closes strongly at:
$53
with increasing volume.
A trader may interpret this as potential breakout confirmation.
But risk still needs to be defined.
Use Case 4 — Breakout Retest
Price breaks:
$50 resistance
and rallies to:
$60.
Later it falls toward:
$50.
If buyers defend the old resistance, the area may now act as support.
This can provide a cleaner setup than chasing the original breakout.
Use Case 5 — False Breakout
Resistance:
$100
Price spikes:
$104
but closes:
$97.
A trader who bought immediately above $100 may become trapped.
Waiting for confirmation can reduce—but never eliminate—this risk.
Use Case 6 — Stop Placement
Suppose support exists:
$90–$92.
A trader entering around support might define invalidation below the entire support structure rather than placing a stop exactly at:
$90.00.
Why?
Because normal volatility can briefly move through obvious levels.
Position sizing must then be adjusted to reflect the wider stop.
Use Case 7 — Profit Targets
A trader buys near support.
Next major resistance:
$120.
That resistance can help determine whether potential reward justifies the trade.
9. Risks & Challenges
Support and resistance are simple concepts but frequently misused.
1. Drawing Too Many Lines
A chart covered with 30 horizontal lines becomes useless.
Prioritize meaningful levels.
2. Treating Levels as Exact Prices
Support at:
$100
does not mean price must reverse at exactly:
$100.00.
Think in zones.
3. Assuming Support Must Hold
Support can fail.
Always define invalidation.
4. Buying Support Blindly
Price reaching support is not sufficient evidence.
Observe how price reacts.
5. Shorting Resistance Blindly
Strong trends can break resistance repeatedly.
6. Ignoring Trend
Buying support in a powerful downtrend can be dangerous.
Market structure matters.
7. Ignoring Higher Timeframes
A small support zone on a 15-minute chart may sit directly above major weekly resistance.
Always check broader context.
8. False Breakouts
Crypto’s volatility makes false breakouts common.
9. Stop Hunting Assumptions
Traders sometimes blame every stop-out on:
“market makers hunting my stop.”
Often the simpler explanation is:
- volatility
- liquidity
- poor stop placement
- weak setup
Avoid turning technical analysis into conspiracy thinking.
10. Moving Stops
A trader defines:
“If support breaks, I exit.”
Support breaks.
The trader moves the stop lower.
Price falls again.
The stop moves again.
Eventually a controlled loss becomes a major loss.
11. Confirmation Bias
Traders often draw levels that support the trade they already want to make.
Levels should be identified before emotional commitment.
12. Leverage
A small temporary break below support can liquidate an overleveraged position even if price later recovers.
10. Future Outlook: 3–5 Years
Support and resistance analysis will increasingly integrate with richer market data.
AI-Detected Price Zones
AI systems may automatically identify:
- historical reaction zones
- volume clusters
- breakout levels
- liquidity areas
Probability-Based Analysis
Instead of:
“Resistance = $100,000”
future tools may estimate:
“The $98,500–$101,000 zone has produced four major historical reactions and contains elevated trading volume.”
This is a more sophisticated interpretation.
Order-Flow Integration
Retail platforms may increasingly combine:
Support/Resistance
Order Book
Volume
Liquidation Data
On-Chain Integration
Crypto-specific platforms can add:
- exchange inflows
- whale activity
- realized price data
- wallet cost basis
This may reveal why certain price zones matter.
Automated Alerts
Instead of staring at charts continuously, traders can receive alerts when:
Price enters major support
or:
Resistance breaks with confirmation.
AI Trading Assistants
Future trading assistants could explain:
“Bitcoin is approaching weekly resistance. Momentum remains positive, but the risk/reward for opening a new long position is deteriorating.”
This would make technical analysis more educational and contextual.
11. Investment & Trading Implications
A beginner can build support-and-resistance analysis systematically.
Step 1 — Start With Higher Timeframes
Open:
Weekly
then:
Daily
charts.
Identify obvious major highs and lows.
Step 2 — Mark Important Zones
Do not mark every minor reaction.
Focus on areas where price produced substantial moves.
Step 3 — Determine Market Structure
Is the market:
Uptrend
Downtrend
or:
Range?
Step 4 — Identify Nearest Support
Ask:
Where did buyers previously become aggressive?
Step 5 — Identify Nearest Resistance
Ask:
Where did sellers previously become aggressive?
Step 6 — Wait for Price
Do not chase the market simply because you identified a level.
Allow price to approach the area.
Step 7 — Read the Candles
Apply what we learned in Article 01.
At support:
- Is there a long lower wick?
- Strong bullish close?
- Bullish engulfing structure?
At resistance:
- Long upper wick?
- Weak close?
- Bearish engulfing structure?
Step 8 — Check Volume
Is participation increasing?
This can provide additional context.
Step 9 — Define Invalidation
Ask:
What price behavior proves my idea wrong?
This is essential.
Step 10 — Calculate Risk-to-Reward
Suppose:
Entry:
$100
Stop:
$95
Target:
$115
Risk:
$5
Potential reward:
$15
Risk-to-reward relationship:
1:3
This does not mean the trade will succeed.
It means the potential outcome can be quantified.
Step 11 — Size the Position
Position size should be based on:
acceptable portfolio loss
rather than:
confidence.
Step 12 — Journal the Setup
Save:
- chart
- support zone
- resistance zone
- entry
- stop
- target
- result
This creates evidence about your trading process.
A Beginner Example
Suppose Bitcoin trades around:
$95,000.
Analysis identifies:
Support Zone
$90,000–$92,000
Resistance Zone
$100,000–$102,000
Price falls toward:
$91,000.
The trader waits.
A four-hour candle forms:
Open:
$91,500
Low:
$89,800
High:
$93,500
Close:
$93,200
Interpretation:
- price moved below support
- lower prices were rejected
- candle closed back above support
- buyers demonstrated strength
Potential setup:
Entry: after confirmation
Invalidation: sustained break below support
Target: toward resistance
But suppose instead price closes:
$88,000
with strong selling volume.
The support thesis has changed.
A disciplined trader does not say:
“Support must eventually work.”
The trader says:
“The market has invalidated my original assumption.”
That difference is critical.
The CoinBrain Support & Resistance Checklist
Before trading around a level, ask:
Timeframe
- Is this level visible on a meaningful timeframe?
History
- Has price reacted here before?
Zone
- Am I treating it as an area rather than an exact number?
Trend
- What is the broader market direction?
Candles
- How is price reacting at the level?
Volume
- Is participation confirming the move?
Breakout
- Did price merely cross the level or actually close beyond it?
Retest
- Has the level changed roles?
Invalidation
- What proves my analysis wrong?
Risk
- How much capital will I lose if wrong?
If these questions cannot be answered, the chart probably needs more analysis before a trade is considered.
Business Implications
Support and resistance are fundamental components of modern trading technology.
Trading platforms can automatically provide:
- price-level alerts
- breakout notifications
- support/resistance detection
- volume analysis
- risk calculators
AI can make these systems significantly more useful.
Instead of simply sending:
“BTC crossed $100,000.”
a more intelligent system might explain:
“Bitcoin has closed above a resistance zone that rejected price three times during the previous two months. Trading volume is above its recent average, but the breakout has not yet been retested.”
This transforms:
price alerts
into:
market intelligence.
12. Final Analysis
Support and resistance provide a framework for answering one of trading’s most important questions:
Where might market behavior change?
Support identifies areas where buyers have previously demonstrated interest.
Resistance identifies areas where sellers have previously demonstrated interest.
But these are not laws.
They are:
evidence from previous market behavior.
A good trader therefore does not say:
“Bitcoin cannot fall below this support.”
The trader says:
“This area previously attracted buyers. I will observe whether they return.”
Similarly:
Not:
“Price must fall from resistance.”
But:
“Sellers previously became active here. I will observe how price reacts.”
This distinction changes trading psychology.
The trader stops predicting with certainty and starts evaluating probabilities.
The most useful framework is:
Identify Level
↓
Wait for Price
↓
Observe Reaction
↓
Seek Confirmation
↓
Define Invalidation
↓
Calculate Risk
↓
Execute or Walk Away
Candlesticks tell us:
how price behaved.
Support and resistance tell us:
where that behavior matters.
Combining the first two articles therefore gives us our first meaningful technical-analysis framework:
Market Structure + Important Price Zone + Candlestick Reaction
That is already far more useful than memorizing dozens of isolated trading patterns.
And it prepares us for the next layer of analysis:
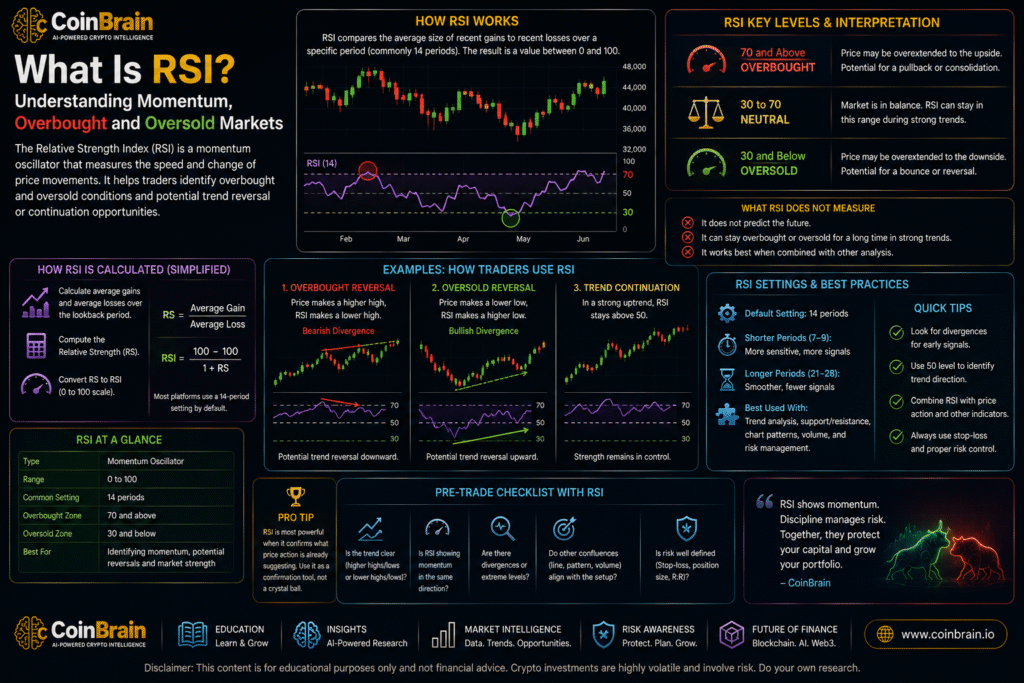
momentum.
That is where RSI enters the picture.
13. References & Further Reading
CMT Association
Technical Analysis Foundations
Professional educational material covering trend analysis, price behavior, support, resistance and broader technical-analysis principles.
CME Group
Technical Analysis Education
Educational resources covering chart analysis, support and resistance, price trends and futures-market concepts.
TradingView
Technical Analysis and Charting
Charting tools and educational resources for identifying historical price levels, market structure and technical indicators.
Coinbase Learn
Crypto Trading and Technical Analysis
Beginner-oriented educational material covering crypto markets, charts and trading concepts.
Binance Academy
Support and Resistance Explained
Educational material discussing support, resistance, trend lines and common technical-analysis applications.
Concepts for Further Study
Readers progressing beyond the fundamentals should investigate:
- horizontal support
- horizontal resistance
- support zones
- resistance zones
- market structure
- higher highs
- higher lows
- lower highs
- lower lows
- trend lines
- role reversal
- breakouts
- breakout retests
- false breakouts
- liquidity
- volume profile
- previous highs and lows
- psychological price levels
- multi-timeframe analysis
- risk-to-reward ratio
CoinBrain Learn Trading
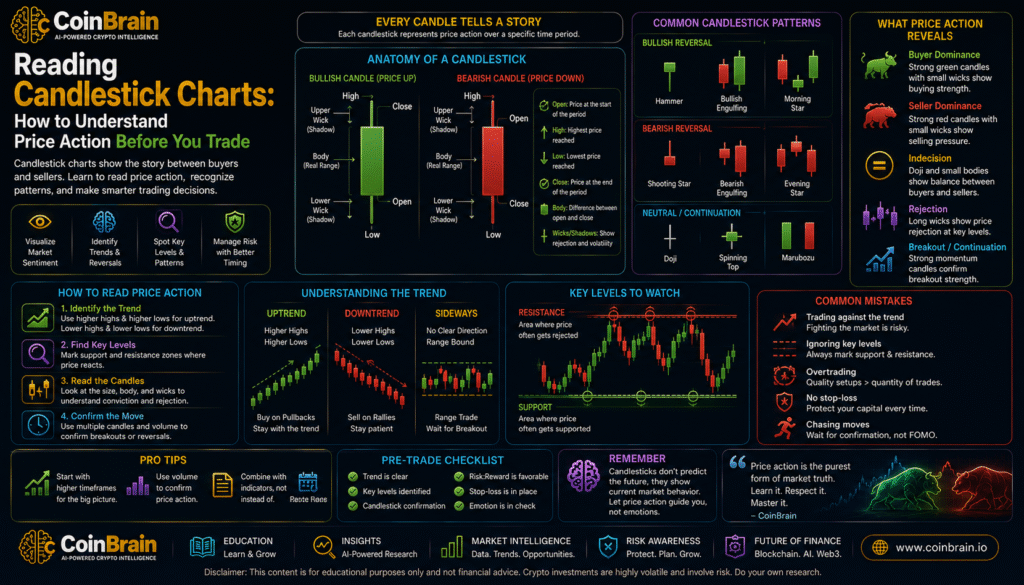
Article 01 — Reading Candlestick Charts: How to Understand Price Action Before You Trade
Article 02 — Support and Resistance: How Traders Identify Important Price Levels
Next Article
Article 03 — What Is RSI? Understanding Momentum, Overbought and Oversold Markets
CoinBrain Research Articles
Research. Understand. Decide.

Leave a Reply
You must be logged in to post a comment.