
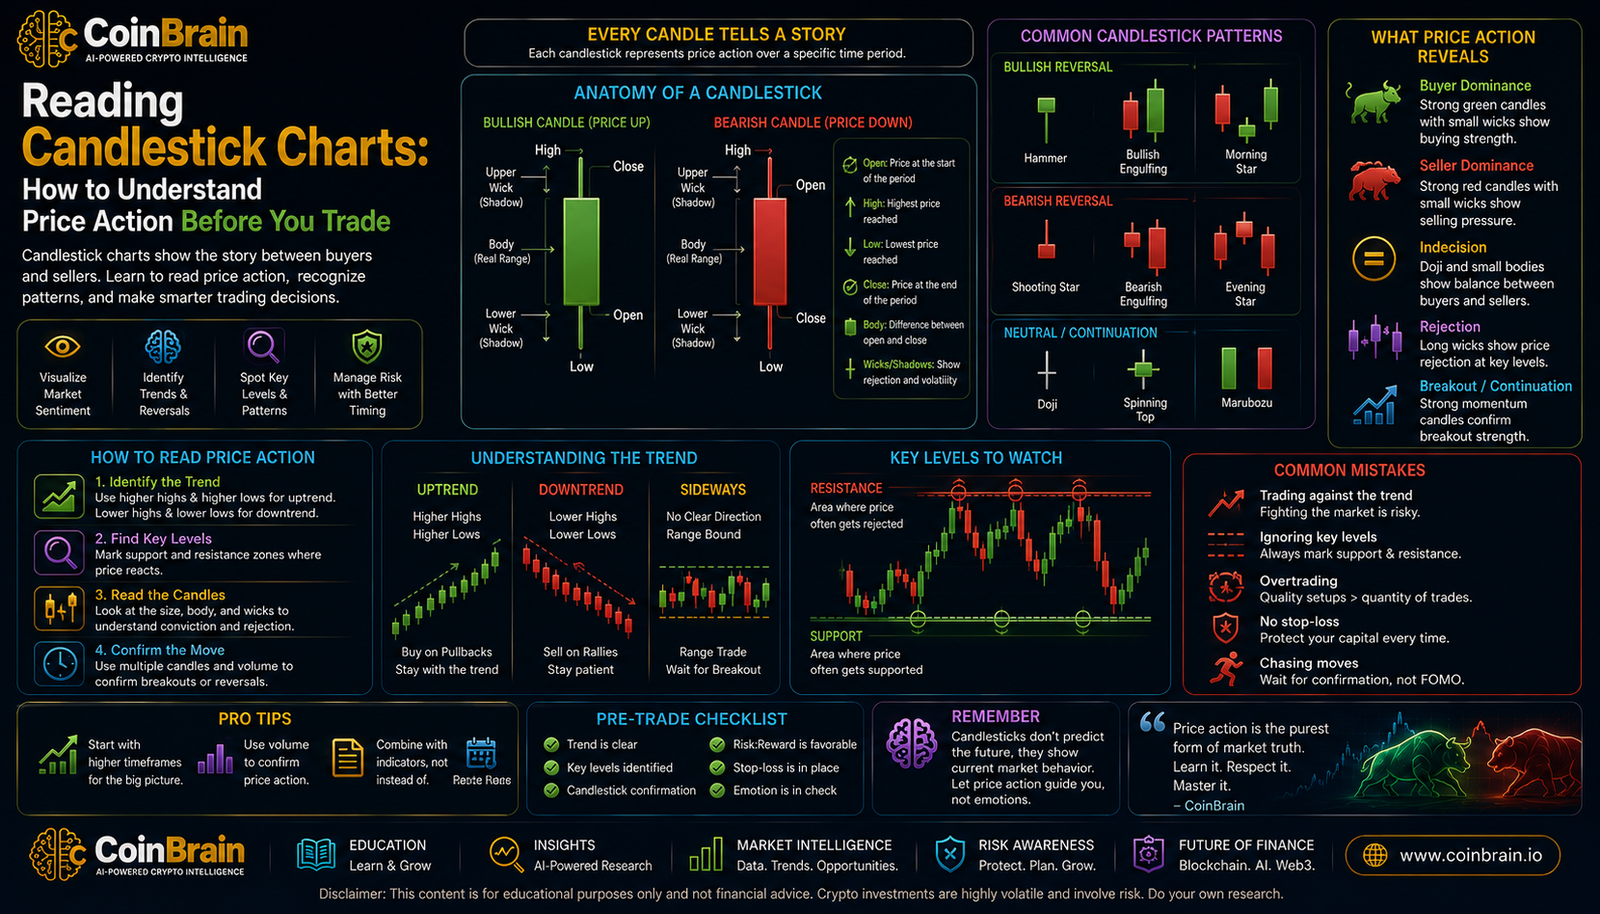

Reading Candlestick Charts: How to Understand Price Action Before You Trade
CoinBrain Research Articles | Learn Trading — Article 01
Updated: August 2026
Before traders learn RSI, MACD, Fibonacci retracements, support and resistance, or advanced market structure, they need to understand the most basic language of a price chart:
Candlesticks.
A candlestick shows how the price of an asset moved during a specific period of time.
One candle might represent:
- one minute
- five minutes
- one hour
- four hours
- one day
- one week
Each candle summarizes four important pieces of market information:
Open
High
Low
Close
Together, these values help traders understand how buyers and sellers behaved during that period.
Candlesticks can reveal:
- strong buying pressure
- aggressive selling
- failed breakouts
- hesitation
- momentum
- rejection
- possible trend exhaustion
But candlesticks should not be treated as magical prediction tools.
A single candle cannot reliably tell you what the market will do next.
The real value of candlestick analysis comes from combining:
Candle Structure + Market Context + Trend + Support and Resistance + Volume + Risk Management
The goal is not to memorize dozens of exotic candlestick names.
The goal is to learn how to read the battle between buyers and sellers directly from price action.
Educational Notice: This article is for educational and research purposes only. It does not constitute financial or investment advice. Technical analysis does not guarantee future price movements. Cryptocurrency trading can involve substantial losses, particularly when leverage is used.
1. Executive Summary
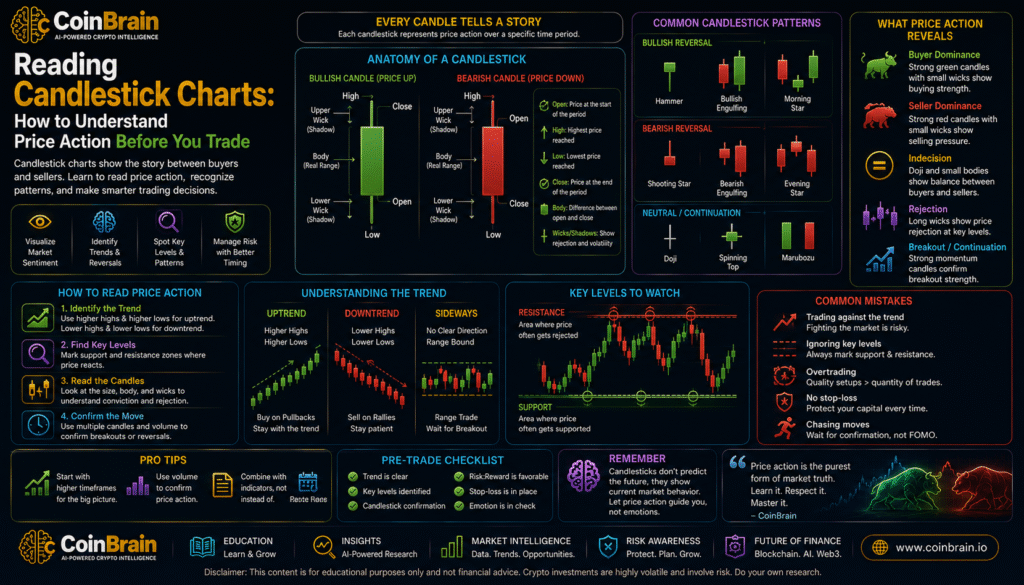
A candlestick is a visual representation of price activity during a selected period.
Each candle contains four values:
Open — High — Low — Close
These are commonly abbreviated:
OHLC
A typical bullish candle indicates that price closed above where it opened.
A bearish candle indicates that price closed below where it opened.
The candle consists of:
- a body
- an upper wick
- a lower wick
The body shows the distance between the opening and closing prices.
The wicks show how far price moved beyond the open and close during the period.
For example:
Open:
$100
High:
$115
Low:
$95
Close:
$110
The candle tells us that:
- price began at $100
- sellers pushed it as low as $95
- buyers pushed it as high as $115
- trading ended at $110
Because the close is above the open, this would normally appear as a bullish candle.
The most useful skill is not memorizing candle names.
It is learning to interpret:
Who controlled the period?
Where was price rejected?
Did momentum strengthen or weaken?
Where did the candle form within the broader market structure?
Candlesticks become far more useful when interpreted in context rather than individually.
2. Key Takeaways
1. Every candlestick contains four prices
These are:
Open
High
Low
Close
2. The candle body shows the open-to-close movement
A large body usually indicates stronger directional movement than a very small body.
3. Wicks show price rejection and intraperiod movement
A long upper wick can indicate selling pressure above.
A long lower wick can indicate buying pressure below.
4. Bullish candles close above their opening price
They generally indicate buyers controlled the period overall.
5. Bearish candles close below their opening price
They generally indicate stronger selling pressure during the period.
6. Candle meaning depends on context
A long lower wick in the middle of random sideways price action may mean little.
The same candle forming at major support after a decline may be more important.
7. Timeframe matters
A bullish five-minute candle can exist inside a bearish daily trend.
8. Candlestick patterns are probabilities—not guarantees
A bullish pattern can fail.
A bearish pattern can fail.
9. Confirmation matters
Traders often combine candle analysis with:
- support and resistance
- volume
- market structure
- momentum indicators
10. Do not memorize dozens of patterns before understanding basic price action
Understanding:
body + wick + location + trend
is more valuable than memorizing 50 pattern names.
11. Candlesticks describe what happened
They do not automatically explain why it happened.
12. Risk management remains essential
Even a technically strong setup can fail.
3. Market Overview
Why Traders Use Charts
Financial markets continuously process:
- buying
- selling
- expectations
- news
- liquidity
- fear
- greed
Prices change as market participants react.
Charts transform these price movements into visual information.
Several chart types exist.
Line Charts
A line chart typically connects closing prices.
It provides a simple visual representation of trend.
But it hides much of the intraperiod information.
Bar Charts
Bar charts also display:
- open
- high
- low
- close
but are less visually intuitive for many beginners.
Candlestick Charts
Candlestick charts display the same OHLC information in a more visual format.
This makes it easier to identify:
- momentum
- rejection
- indecision
- trend changes
They are widely used across:
- cryptocurrency
- stocks
- forex
- commodities
- futures
Why Candlesticks Work Well in Crypto
Crypto markets operate:
24 hours per day
7 days per week
Price moves constantly.
Candlestick charts compress this continuous stream into manageable time periods.
For example:
1-Minute Candle
Summarizes one minute.
1-Hour Candle
Summarizes one hour.
Daily Candle
Summarizes approximately one day of trading according to the chart provider’s session convention.
Price Action
Candlesticks are part of a broader trading approach called:
Price Action Analysis
Price action focuses primarily on how price itself behaves.
Instead of relying only on mathematical indicators, traders study:
- highs
- lows
- trends
- candles
- breakouts
- support
- resistance
Candlesticks form the foundation of this approach.
4. Technical Deep Dive
Anatomy of a Candlestick
Every standard candlestick has three main components:
Body
Upper Wick
Lower Wick
The Body
The body represents the distance between:
Open
and:
Close
Suppose:
Open:
$50
Close:
$60
Price rose:
$10
The candle body spans from $50 to $60.
Bullish Candle
A bullish candle occurs when:
Close > Open
Example:
Open:
$100
Close:
$110
Buyers controlled the net movement during the period.
Bearish Candle
A bearish candle occurs when:
Close < Open
Example:
Open:
$100
Close:
$90
Sellers controlled the net movement.
Upper Wick
The upper wick shows how high price traveled before the period ended.
Example:
Open:
$100
High:
$120
Close:
$105
Price reached $120 but could not remain there.
This may indicate:
rejection at higher prices.
Lower Wick
The lower wick shows how low price traveled.
Example:
Open:
$100
Low:
$80
Close:
$98
Price fell sharply but recovered before closing.
This may indicate buyers entered at lower prices.
Reading Candle Strength
Consider two bullish candles.
Candle A
Open:
$100
Close:
$101
Candle B
Open:
$100
Close:
$115
Both are bullish.
But Candle B demonstrates far stronger directional movement.
Large bodies often indicate stronger momentum.
Reading Wicks
Wicks can provide information about failed price movement.
Long Upper Wick
Price moved higher but sellers pushed it back down.
Possible interpretation:
higher-price rejection
Long Lower Wick
Price moved lower but buyers pushed it back up.
Possible interpretation:
lower-price rejection
Again, context matters.
Closing Location
Where a candle closes within its total range is very important.
Imagine:
High:
$110
Low:
$90
Close:
$109
Price closed near the high.
This suggests strong buying pressure into the close.
Compare:
High:
$110
Low:
$90
Close:
$92
This suggests sellers controlled the later part of the period.
Timeframes
The same asset can look completely different depending on timeframe.
For example:
5-Minute Chart
Short-term bullish.
1-Hour Chart
Sideways.
Daily Chart
Bearish.
All can be true simultaneously.
This leads to:
Multi-Timeframe Analysis
Multi-Timeframe Analysis
A trader might analyze:
Higher Timeframe
Determine overall trend.
Example:
Daily chart.
Medium Timeframe
Identify setup.
Example:
4-hour chart.
Lower Timeframe
Fine-tune entry.
Example:
15-minute chart.
This avoids making decisions based on one isolated candle.
Common Candlestick Structures
Beginners do not need to memorize every pattern.
A few structures are enough to understand the logic.
Doji
A Doji occurs when open and close are very close together.
This creates a very small body.
Interpretation:
indecision
Buyers and sellers competed, but neither established clear control.
A Doji after a powerful uptrend may indicate hesitation.
But a Doji in a sideways market may mean almost nothing.
Hammer
A typical Hammer contains:
- small body
- long lower wick
- little upper wick
When it forms after a decline, it can suggest:
buyers rejected lower prices.
But confirmation is still required.
Shooting Star
A typical Shooting Star has:
- small body
- long upper wick
- small lower wick
After a rally, it may indicate:
higher prices were rejected.
Bullish Engulfing
Two-candle structure.
First:
bearish candle.
Second:
larger bullish candle whose body overtakes the previous body.
It can suggest momentum shifting toward buyers.
Bearish Engulfing
Opposite structure.
A larger bearish candle overwhelms the previous bullish candle.
Potential interpretation:
sellers have taken control.
Inside Bar
A candle forms entirely within the previous candle’s range.
This can signal:
- consolidation
- reduced volatility
- potential breakout preparation
Outside Bar
A candle trades above the previous high and below the previous low.
This indicates expanded volatility.
Its interpretation depends heavily on how it closes.
5. Current Industry Landscape
Candlestick analysis remains one of the most widely used forms of technical analysis.
Modern traders apply it across:
- crypto exchanges
- professional trading platforms
- charting software
- derivatives markets
But the way professional traders use candlesticks differs from many beginner approaches.
Retail Trading
Beginners often search for:
“Best Candlestick Pattern”
or:
“100% Accurate Pattern.”
No such pattern exists.
Professional analysis focuses more heavily on:
context.
Algorithmic Markets
Modern markets contain:
- algorithmic trading
- automated market makers
- high-frequency participants
- institutional execution systems
This means candles are not created solely by human emotions.
They summarize the outcome of many trading systems interacting.
Crypto-Specific Market Structure
Crypto markets also differ from traditional equities.
Characteristics include:
- 24/7 markets
- fragmented exchanges
- high leverage
- perpetual futures
- liquidation cascades
Large wicks can therefore sometimes result from:
leveraged liquidations
rather than ordinary buying or selling.
Exchange Differences
Bitcoin might trade simultaneously on:
- Binance
- Coinbase
- Kraken
- other venues
Candles can differ slightly because:
- order books differ
- liquidity differs
- pricing differs
Therefore, two charts may not always show identical wick extremes.
6. Institutional Activity
Institutional traders use candlestick charts—but rarely in isolation.
Professional analysis may combine:
- price action
- order flow
- volume
- liquidity
- derivatives positioning
- macroeconomic analysis
Institutional Interpretation
A professional trader may see a long lower wick and ask:
Why did price reject this area?
Was it:
- institutional buying?
- liquidation?
- support?
- liquidity sweep?
- news reaction?
The candle is evidence.
It is not automatically the explanation.
Execution
Institutions also care about:
- average execution price
- market depth
- slippage
A candle can show that price moved dramatically, but it does not reveal the entire liquidity structure behind that movement.
Higher Timeframes
Longer-term institutional investors may emphasize:
- daily
- weekly
- monthly candles
more than minute-level activity.
A weekly candle contains far more information about long-term positioning than a one-minute candle.
Derivatives Traders
Futures traders may combine candles with:
- open interest
- funding rates
- liquidation data
For example:
Large bearish candle
major decline in open interest
may suggest leveraged positions were closed.
7. Market Data & Metrics
Candlestick analysis uses several basic price metrics.
1. Open
First traded price within the candle period.
2. High
Highest price reached.
3. Low
Lowest price reached.
4. Close
Final price recorded for the period.
5. Candle Range
Formula:
Range = High − Low
Example:
High:
$110
Low:
$90
Range:
$20
6. Body Size
Formula:
Body = |Close − Open|
Example:
Open:
$100
Close:
$108
Body:
$8
7. Upper Wick
For a bullish candle:
Upper Wick = High − Close
Example:
High:
$112
Close:
$108
Upper wick:
$4
8. Lower Wick
For a bullish candle:
Lower Wick = Open − Low
Example:
Open:
$100
Low:
$95
Lower wick:
$5
9. Body-to-Range Ratio
Suppose:
Total range:
$20
Body:
$16
Body represents:
80% of total range.
This suggests relatively strong directional movement.
10. Closing Position
Ask:
Did price close near:
- high?
- middle?
- low?
This can be more informative than simply asking whether the candle is green or red.
11. Volume
Candles become significantly more informative when combined with volume.
Example:
Large bullish candle + strong volume
may suggest stronger participation.
We will examine volume in detail later in this series.
8. Real-World Use Cases
Use Case 1 — Reading Momentum
Suppose Bitcoin produces several consecutive large bullish candles.
Each closes near its high.
This suggests:
strong buying momentum.
But it does not guarantee continuation.
Use Case 2 — Identifying Rejection
Bitcoin approaches:
$100,000
Price trades to:
$102,000
but closes at:
$96,000
leaving a long upper wick.
This suggests strong rejection above $100,000.
If the level has previously acted as resistance, the candle becomes more significant.
Use Case 3 — Identifying Buying Pressure
Ethereum falls toward established support.
During the day:
Low:
$3,000
Close:
$3,300
A long lower wick forms.
The candle suggests buyers responded strongly below.
Use Case 4 — Breakout Confirmation
Suppose resistance sits around:
$50
Price briefly trades to:
$52
but closes:
$49
This may represent a failed breakout.
Compare with:
Price opens:
$49
trades to:
$55
and closes:
$54.50
A strong close above resistance provides more convincing breakout evidence.
Use Case 5 — Trend Continuation
During an uptrend:
- pullbacks are small
- bullish candles remain strong
- closes stay near highs
This can indicate persistent demand.
Use Case 6 — Trend Weakness
Imagine an uptrend where:
- bullish bodies become smaller
- upper wicks become longer
- bearish candles become larger
Momentum may be weakening.
Use Case 7 — Entry Timing
A trader identifies:
major support
on the daily chart.
Rather than buying immediately, the trader waits for evidence such as:
lower-price rejection
on a smaller timeframe.
Candlestick analysis helps refine the entry.
9. Risks & Challenges
Candlestick analysis is useful—but easy to misuse.
1. Pattern Memorization
Beginners often memorize names without understanding price behavior.
This produces weak analysis.
2. Ignoring Context
A Hammer does not automatically mean:
Buy.
Its location matters.
3. Using Very Small Timeframes
One-minute charts contain significant noise.
Beginners can become overwhelmed by meaningless short-term movements.
4. Overtrading
When traders search constantly for candle patterns, they begin seeing setups everywhere.
Not every candle requires action.
5. False Breakouts
Price can briefly move beyond a level and immediately reverse.
This is why closing behavior matters.
6. Leverage
A correct candlestick interpretation can still fail.
High leverage can make small errors catastrophic.
7. Ignoring Volume
A price breakout with weak participation may be less convincing.
8. News Events
Unexpected:
- regulation
- economic data
- exchange problems
- geopolitical events
can immediately invalidate chart setups.
9. Confirmation Bias
A bullish investor may interpret every candle as bullish.
A bearish trader may do the opposite.
Analysis should begin with evidence.
10. Survivorship Bias in Online Examples
Social media often shows:
perfect historical candlestick patterns
where price subsequently moved exactly as expected.
Failed examples receive less attention.
11. Candle Color Obsession
Green does not automatically mean bullish future conditions.
Red does not automatically mean bearish future conditions.
Where and how the candle forms matters more.
12. No Pattern Is 100% Reliable
Technical analysis deals in:
probabilities
not:
certainties.
10. Future Outlook: 3–5 Years
Candlestick charts are unlikely to disappear.
But the way traders analyze them will continue evolving.
AI-Assisted Technical Analysis
AI systems may automatically identify:
- candle formations
- support levels
- market structure
- volume anomalies
This could make chart analysis more accessible.
Context-Aware Pattern Detection
Rather than saying:
“Hammer detected.”
future systems may say:
“Hammer detected at weekly support after a 25% decline with above-average volume.”
That context is far more useful.
Integration with On-Chain Data
Crypto analysis may increasingly combine:
Candlesticks
Exchange Flows
Wallet Activity
Derivatives
This creates richer market analysis.
More Advanced Order-Flow Tools
Retail traders may gain improved access to:
- liquidity maps
- order-book analytics
- liquidation data
Candlesticks could become the visual surface of a much deeper analytical system.
Automation Will Increase
More market activity will be algorithmic.
But candlesticks will remain valuable because they summarize the final outcome of:
all market participants combined.
11. Investment & Trading Implications
For beginners, candlestick analysis should be learned in a structured sequence.
Step 1 — Learn OHLC
Know immediately how to identify:
Open
High
Low
Close
Step 2 — Read the Body
Ask:
Was the period strongly directional or indecisive?
Step 3 — Read the Wicks
Ask:
Where did price encounter rejection?
Step 4 — Check the Close
Did price finish near:
- high?
- low?
- middle?
The close often provides valuable information.
Step 5 — Identify Trend
Before interpreting a candle, determine whether the broader market is:
Uptrend
Downtrend
or:
Range
Step 6 — Identify Location
Where is the candle forming?
Near:
- support?
- resistance?
- breakout?
- trend line?
This dramatically affects interpretation.
Step 7 — Check Higher Timeframe
Suppose you find a bullish pattern on:
15-minute chart.
Check:
4-hour
and:
daily
charts.
Do they support the idea?
Step 8 — Look for Confirmation
Useful confirmations can include:
- next candle
- volume
- support/resistance
- market structure
Step 9 — Define Risk Before Entry
Never say:
“The candle looks bullish, so I’ll buy.”
Instead define:
Entry
Invalidation
Stop
Position Size
Step 10 — Record the Trade
Keep a journal.
Record:
- chart
- setup
- candle pattern
- context
- outcome
Over time, you can determine which setups actually work for you.
A Beginner Example
Suppose Bitcoin has been declining.
Major support:
$90,000
Price reaches:
$89,500
During the four-hour candle:
Low:
$87,000
High:
$92,000
Open:
$90,000
Close:
$91,800
The candle has:
- long lower wick
- bullish body
- close near high
Possible interpretation:
Strong rejection below support.
But a disciplined trader does not immediately conclude:
Bitcoin must rise.
Instead:
Context
Price is near support.
Candle
Strong lower rejection.
Confirmation
Wait for next candle or breakout of local structure.
Risk
Define invalidation below support.
This converts candle reading into a trading framework.
The CoinBrain Candlestick Checklist
Before trading a candle pattern, ask:
Structure
- What are the open, high, low and close?
Body
- Is the body large or small?
Wicks
- Where was price rejected?
Close
- Did the candle close strongly?
Trend
- Uptrend, downtrend or range?
Location
- Support, resistance or nowhere important?
Timeframe
- What does the higher timeframe show?
Volume
- Is participation supporting the move?
Risk
- Where is the setup invalidated?
Reward
- Is potential reward reasonable relative to risk?
If the only reason for the trade is:
“I saw a Hammer.”
the analysis is incomplete.
Business Implications
Candlestick analysis is also central to trading technology.
Platforms build services around:
- interactive charting
- technical indicators
- market alerts
- pattern recognition
- automated trading
- AI trading assistants
The next generation of trading platforms may move from:
showing charts
toward:
explaining charts.
For example:
“Bitcoin is testing a previous resistance zone. The latest daily candle shows upper-wick rejection while trading volume has increased.”
This could help newcomers learn market structure without relying on simplistic:
Buy/Sell Signals.
12. Final Analysis
Candlesticks are the alphabet of technical analysis.
Before understanding:
RSI
MACD
Fibonacci
or:
advanced trading strategies
you must first understand what price itself is doing.
Every candle tells a story.
The body describes:
direction.
The wicks describe:
rejection.
The range describes:
volatility.
The close describes:
where the battle ended.
But one candle never tells the entire story.
Its meaning depends on:
Trend
Location
Volume
Market Structure
Timeframe
This leads to the most important principle of candlestick analysis:
Do not trade the candle. Trade the context around the candle.
A Hammer in random market noise is just a candle.
A Hammer appearing after a major decline at established support with strong volume may deserve much more attention.
Similarly:
A large green candle is not automatically bullish.
If it appears after an enormous rally and immediately encounters major resistance, the risk/reward may be poor.
The goal is therefore not:
Memorize every candlestick pattern.
The goal is:
Learn to read price behavior.
Ask:
Who is in control?
Where did buyers enter?
Where did sellers respond?
Was price accepted or rejected?
Is momentum strengthening or weakening?
Once those questions become natural, candlesticks stop looking like colored rectangles.
They become:
a visual record of market behavior.
And that is the foundation on which the rest of technical analysis is built.
13. References & Further Reading
CME Group
Candlestick Chart Education
Educational resources explaining OHLC data, candlestick construction and how traders interpret market price behavior.
CMT Association
Technical Analysis Foundations
Professional educational material covering price analysis, charting, trend identification and technical-analysis principles.
TradingView
Candlestick Charts
Charting documentation and educational resources covering candle construction, timeframes and technical market visualization.
Coinbase Learn
Crypto Charts and Market Analysis
Beginner educational resources covering crypto price charts, trading terminology and technical-analysis concepts.
Binance Academy
Candlestick Charts Explained
Educational material covering candlestick anatomy, bullish and bearish candles and common price-action patterns.
Concepts for Further Study
Readers progressing beyond the fundamentals should investigate:
- OHLC
- price action
- bullish candles
- bearish candles
- candle bodies
- candle wicks
- Doji
- Hammer
- Shooting Star
- engulfing patterns
- inside bars
- outside bars
- market structure
- multi-timeframe analysis
- trend analysis
- support and resistance
- breakout confirmation
- volume
- risk-to-reward ratio
CoinBrain Learn Trading
Article 01 — Reading Candlestick Charts: How to Understand Price Action Before You Trade
Next Article
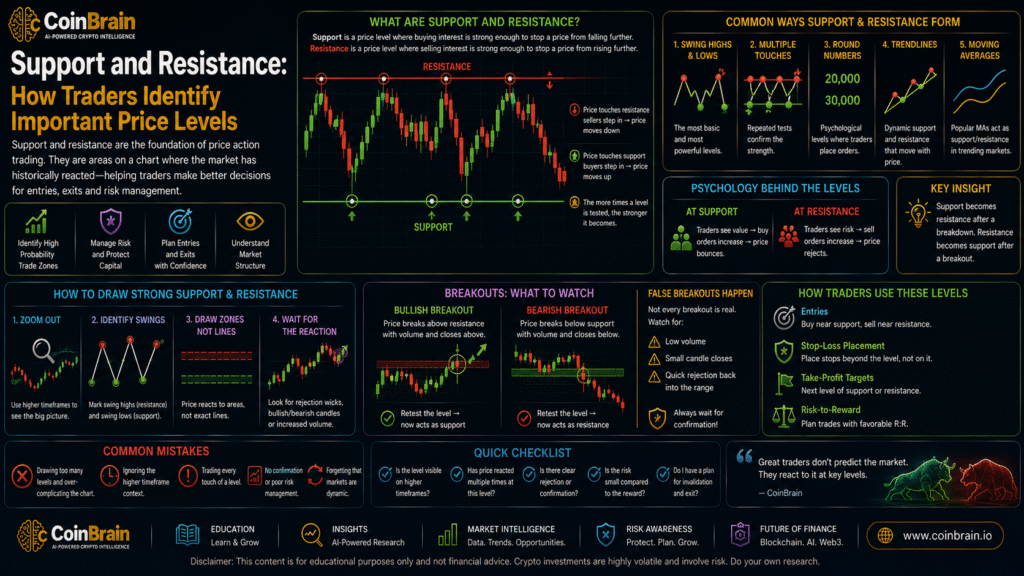
Article 02 — Support and Resistance: How Traders Identify Important Price Levels
CoinBrain Research Articles
Research. Understand. Decide.
Leave a Reply
You must be logged in to post a comment.